Showing 1–20 of 508
-
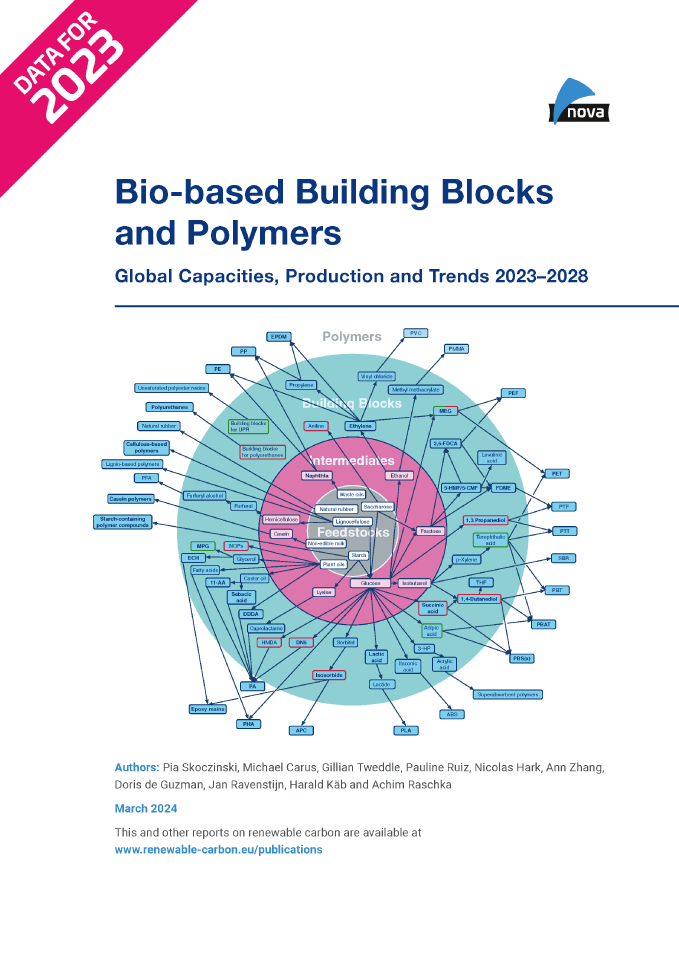
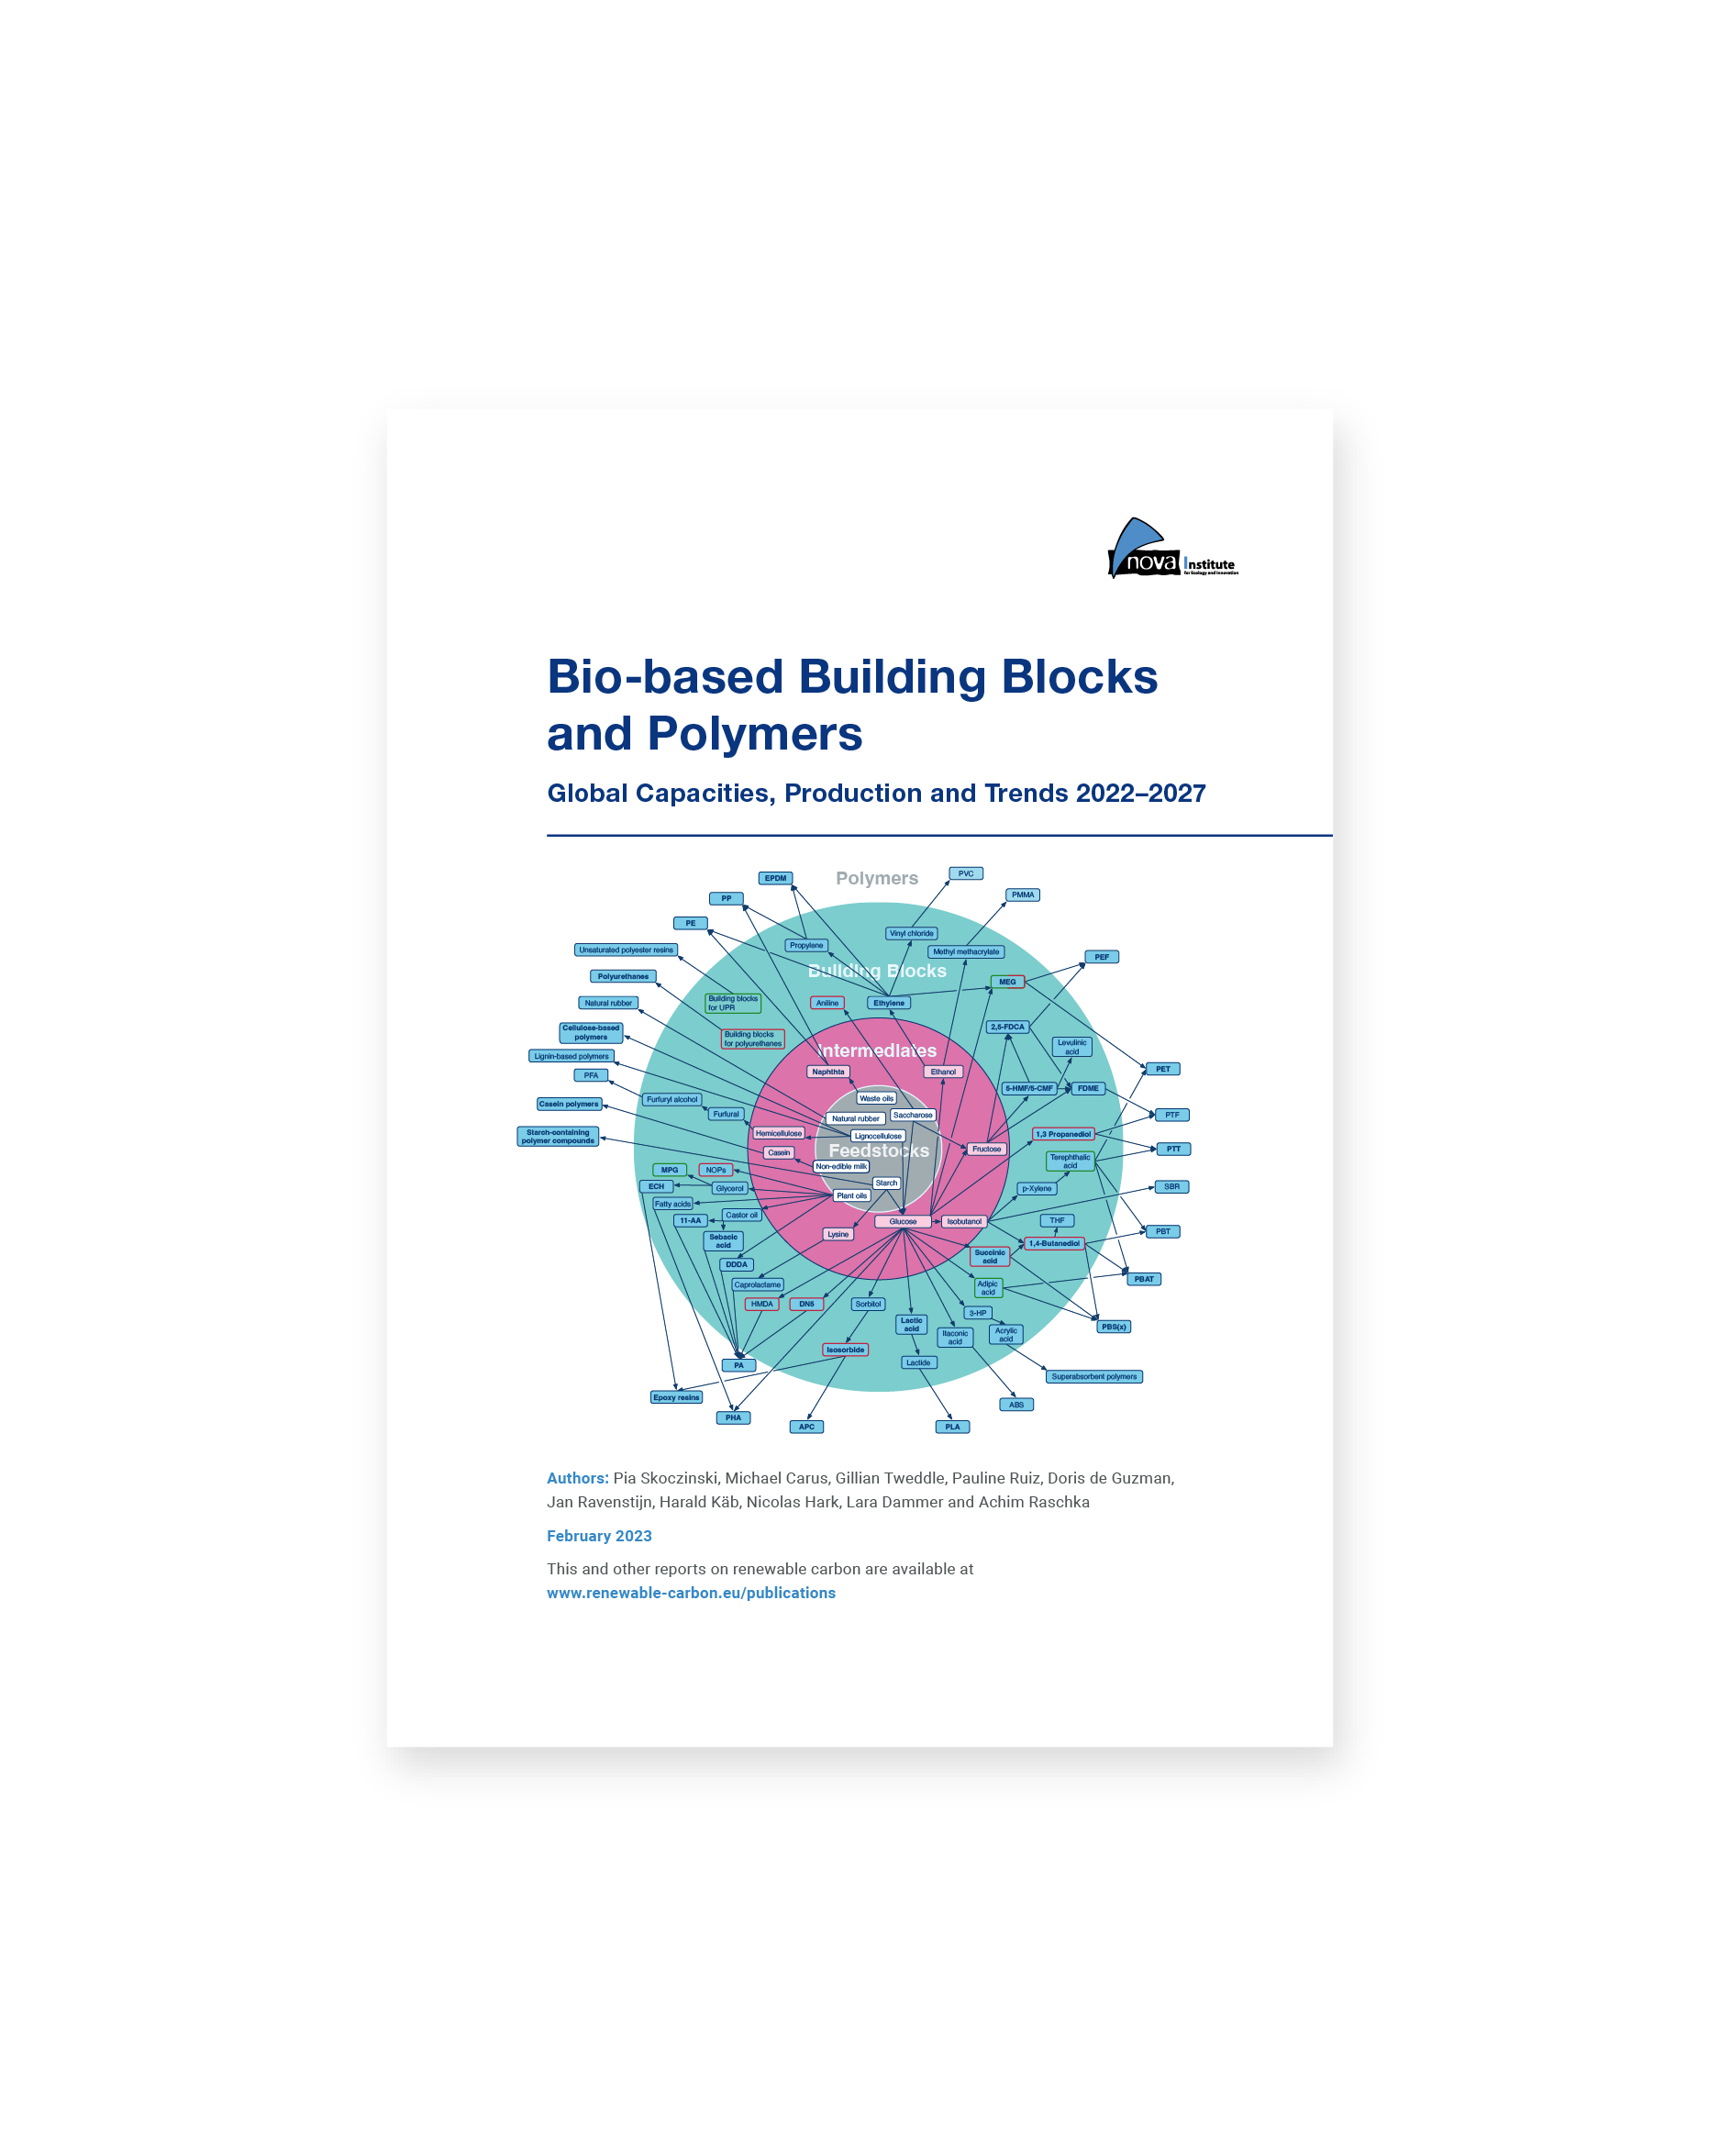
Bio-based Building Blocks and Polymers – Global Capacities, Production and Trends 2023–2028 – Short Version (PDF)
NewMarkets & Economy
28 Pages
851 Downloads851 Downloads
2024-03
FREE
851
DownloadsNew report released on the global bio‑based polymer market 2023 – a deep and comprehensive insight into a dynamically growing market
The year 2023 was a promising year for bio‑based polymers: PLA capacities have been increased by almost 50 %, and at the same time polyamide capacities are steadily increasing, as well as epoxy resin production. Capacities for 100 % bio-based PE have been expanded and PE and PP made from bio‑based naphtha are being further established with growing volumes. Current and future expansions for PHAs are still on the horizon. After hinting at a comeback in 2022 bio-based PET production dropped in 2023 by 50 %.
DOI No.: https://doi.org/10.52548/VXTH2416
-
Bio-based Building Blocks and Polymers – Global Capacities, Production and Trends 2023–2028 (PDF)
NewMarkets & Economy
438 Pages
2024-03
3,000 € – 10,000 € ex. tax
Plus 19% MwSt.
licenceNew report released on the global bio‑based polymer market 2023 – a deep and comprehensive insight into a dynamically growing market
The year 2023 was a promising year for bio‑based polymers: PLA capacities have been increased by almost 50 %, and at the same time polyamide capacities are steadily increasing, as well as epoxy resin production. Capacities for 100 % bio-based PE have been expanded and PE and PP made from bio‑based naphtha are being further established with growing volumes. Current and future expansions for PHAs are still on the horizon. After hinting at a comeback in 2022 bio-based PET production dropped in 2023 by 50 %.
DOI No.: https://doi.org/10.52548/VXTH2416
-
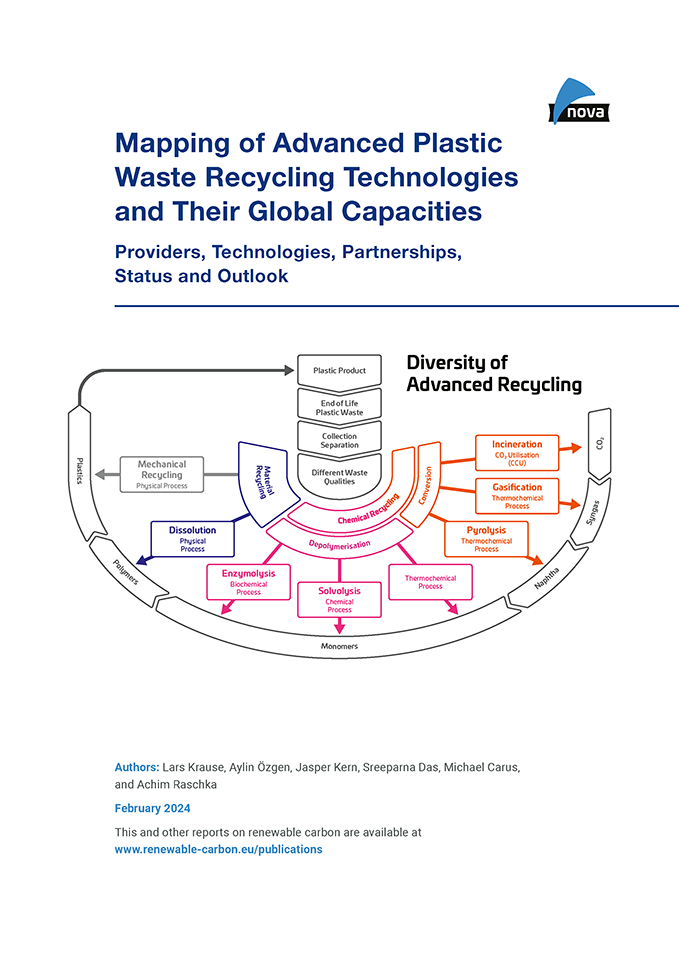
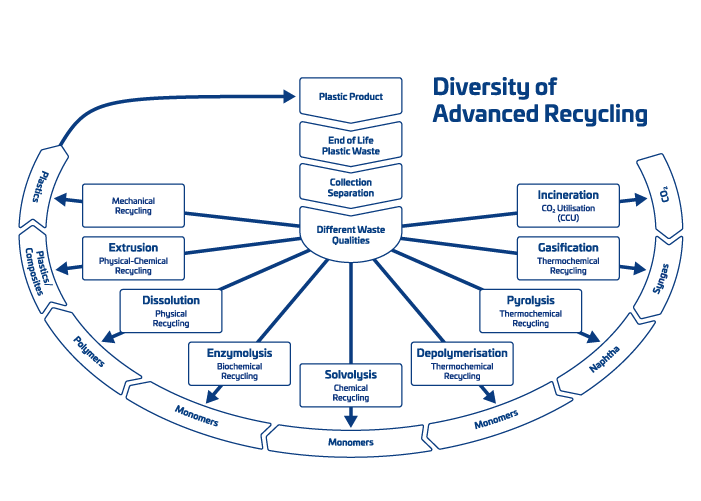
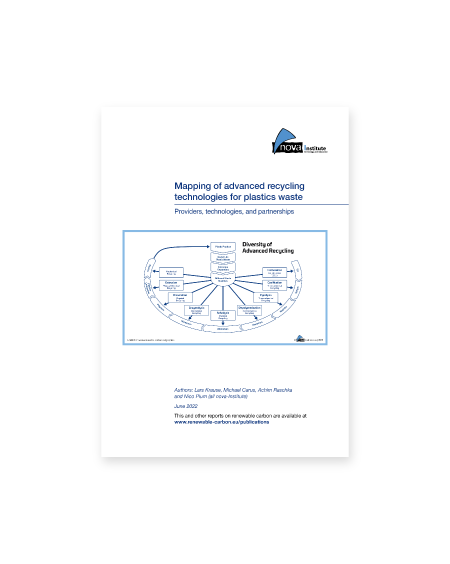
Mapping of advanced plastic waste recycling technologies and their global capacities – Short Version (PDF)
NewMarkets & Economy, Technology
12 Pages
825 Downloads825 Downloads
2024-02
FREE
825
DownloadsAdvanced recycling technologies are developing at a fast pace, with new players constantly appearing on the market, from start-ups to giants and everything in between – new plants are being built, new capacities are being achieved, and new partnerships are established. Due to these developments, it is difficult to keep track of everything. The report “Mapping of advanced plastic waste recycling technologies and their global capacities” aims to clear up this jungle of information providing a structured, in-depth overview and insight. It has an exclusive focus on profiling available technologies and providers of advanced recycling including the addition of new technologies and updated/revised profiles. Furthermore, for the first time a comprehensive evaluation of the global input and output capacities was carried out for which more than 340 planned as well as installed and operating plants including their specific product yields were mapped.
Further information:
The new report “Mapping of advanced plastic waste recycling technologies and their global capacities” differs from the old report “Chemical Recycling – Status, Trends and Challenges” as follows:- All technology provider profiles from the old report included + updated to 2023.
- Overall >120 technologies and providers (vs. >70 technologies and providers in the old report)
- Global capacities
In summary, this report is suitable for interested readers who have already dealt with the advanced recycling topic and are looking for an up-to-date overview of all identified providers and a detailed description of the technologies.
-
Mapping of advanced plastic waste recycling technologies and their global capacities (PDF)
NewMarkets & Economy, Technology
276 Pages
2024-02
3,000 € – 10,000 € ex. tax
Plus 19% MwSt.
licenceAdvanced recycling technologies are developing at a fast pace, with new players constantly appearing on the market, from start-ups to giants and everything in between – new plants are being built, new capacities are being achieved, and new partnerships are established. Due to these developments, it is difficult to keep track of everything. The report “Mapping of advanced plastic waste recycling technologies and their global capacities” aims to clear up this jungle of information providing a structured, in-depth overview and insight. It has an exclusive focus on profiling available technologies and providers of advanced recycling including the addition of new technologies and updated/revised profiles. Furthermore, for the first time a comprehensive evaluation of the global input and output capacities was carried out for which more than 340 planned as well as installed and operating plants including their specific product yields were mapped.
Further information:
The new report “Mapping of advanced plastic waste recycling technologies and their global capacities” differs from the old report “Chemical Recycling – Status, Trends and Challenges” as follows:- All technology provider profiles from the old report included + updated to 2023.
- Overall >120 technologies and providers (vs. >70 technologies and providers in the old report)
- Global capacities
In summary, this report is suitable for interested readers who have already dealt with the advanced recycling topic and are looking for an up-to-date overview of all identified providers and a detailed description of the technologies.
DOI No.: https://doi.org/10.52548/WQHT8696
-
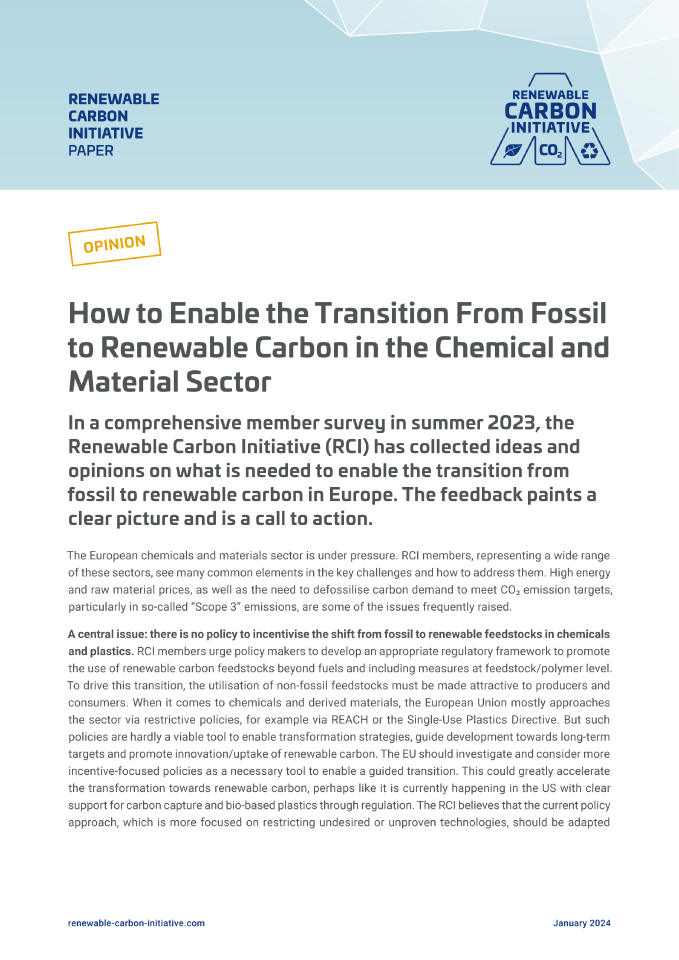
RCI’s Internal Survey: „How to enable the transition from fossil to renewable carbon in the chemical and material sector“ (January 2024)
NewPolicy, Sustainability & Health
3 Pages
278 Downloads278 Downloads
2024-01
FREE
278
DownloadsIn a comprehensive member survey in summer 2023, the Renewable Carbon Initiative (RCI) has collected ideas and opinions on what is needed to enable the transition from fossil to renewable carbon in Europe. The feedback paints a clear picture and is a call to action.
The European chemicals and materials sector is under pressure. RCI members, representing a wide range of these sectors, see many common elements in the key challenges and how to address them. High energy and raw material prices, as well as the need to defossilise carbon demand to meet CO2 emission targets, particularly in so-called “Scope 3” emissions, are some of the issues frequently raised.
-
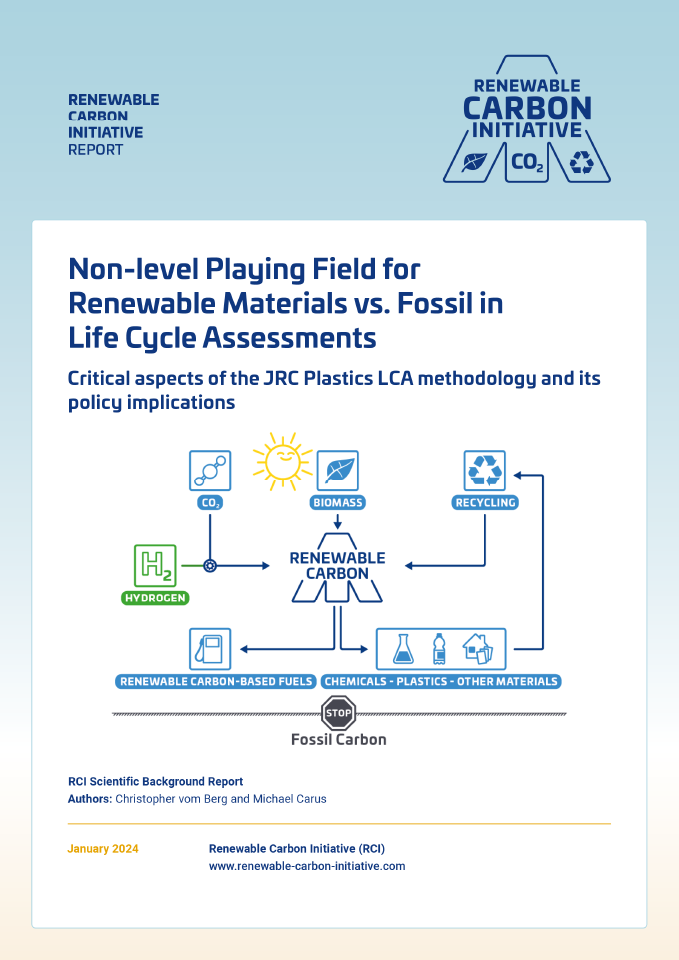
RCI’s scientific background report: “Non-level playing field for renewable materials vs. fossil in Life Cycle Assessments – Critical aspects of the JRC Plastics LCA Methodology and its policy implications” (January 2024)
NewPolicy, Sustainability & Health
44 Pages
861 Downloads861 Downloads
2024-01
FREE
861
DownloadsCritical aspects of the JRC Plastics LCA methodology and its policy implications
This RCI Scientific Background Report was mainly motivated by a study published by JRC in 2021 with the title: “LCA of alternative feedstocks for plastic products”, commonly referred to as the JRC Plastics LCA Method (Nessi et al. 2021).
Alternative feedstocks refer to the same three feedstocks that RCI defines as renewable carbon: biomass, CO2 utilisation and recycling. The study describes a methodology developed by the JRC to compare the environmental performance of alternative feedstocks with fossil-based plastic products. However, the methodology has also been subject to criticism from various stakeholders, mainly from the bio-based sector, eliciting responses from the JRC.
This RCI report is mainly aiming to provide additional context to highlight issues that might arise with implementation of the JRC Plastics LCA methodology, and dives deeper into five aspects:
- The fossil footprint is likely underestimated, not transparent and lacks regional differentiation
- Renewable feedstocks are more cirtically evaluated than fossil feedstocks
- Methodological inconsistency and different regulatory support between energy and material use of renewable feedstocks
- Biogenic/Atmospheric carbon uptake cannot be transparently visualised at factory in PEF / JRC Plastics LCA methodologies
- The methodology should acknowledge the wider interface of sustainability assessment, policy design and landscape
The report contains several recommendations to remedy the above-mentioned aspects.
-
RCI’s scientific background report: “Case studies based on peer-reviewed Life Cycle Assessments – Carbon footprints of different carbon-based chemicals and materials” (November 2023)
NewSustainability & Health
39 Pages
1348 Downloads1348 Downloads
2023-11
FREE
1348
DownloadsIn this brochure, the RCI (https://renewable-carbon-initiative.com) presents five peer-reviewed LCA case studies – representing the highest possible scientific standard – that examine the carbon footprint of materials and products made from renewable carbon. These case studies are on products from RCI member companies Avantium (NL), BASF (DE), IFF (US), Lenzing (AT), Neste (FI) and all LCAs have been peer-reviewed by external experts. The LCAs have been summarised by experts of nova-Institutes sustainability team.
The case studies visualise that there are not only competitive materials and products made of renewable carbon already on the market, but that they also come with significantly lower carbon footprints ranging from 30–90%.
A key aspect of replacing fossil carbon with renewable carbon is the gained circularity of carbon. The less additional fossil carbon is added to our above-ground cycle of atmosphere, biosphere and technosphere, the smaller will be the amount of carbon emissions that have to be balanced out with expensive atmospheric removal and underground storage of carbon.
It is essential to recognise that the carbon footprint of renewable carbon-based materials is not automatically close to zero for two primary reasons:
- Fossil energy in the value chain
- Ongoing innovation and optimisation
All in all, the here presented materials and products show reduced carbon footprints already today, which lowers the remaining emissions gap so that less CO2 needs to be removed from the atmosphere in the future. At the same time, these materials and products still have significant potential to further reduce emissions in the future.
-
Carbon Dioxide (CO₂) as Feedstock for Chemicals, Advanced Fuels, Polymers, Proteins and Minerals (PDF)
NewMarkets & Economy, Technology
242 Pages
2023-04
2,500 € – 10,000 € ex. tax
Plus 19% MwSt.Press
release Select
licenceNew report on the use of CO₂ for chemicals, advanced fuels, polymers, proteins and minerals by nova-Institute – A deep and comprehensive insight into the evolving technologies, trends and the dynamically growing market of CO₂ transformation and utilisation.
Several successfully implemented technologies are now in commercial use, and many more are at the laboratory and pilot stage. A current total production capacity of novel CO₂-based products of about 1.3 Mt/a in 2022 is observed. The production capacity in 2022 is dominated by the production of CO₂-based aromatic polycarbonates, ethanol from captured CO/CO₂, aliphatic polycarbonate and methanol. By 2030, the capacity outlook for CO₂-based products is expected to exceed 6 Mt/a of CO₂-based products. High dynamic growth is observed for methanol projects, methane plants, ethanol and hydrocarbons – the latter especially for the aviation sector. The potential of CCU has been recognised by several global brands which are already expanding their feedstock portfolio. However, in Europe, investments and prospects for CO₂ utilisation are largely undermined by a lack of political support. In contrast, we see supportive policies in China as well as in the US with the Inflation Reduction Act. Such smart policies are needed to bridge the gap between now and 2050 for companies to remain competitive in the sustainable transformation.nova-Institute’s new report examines this renewable carbon source in detail: Which products can be made from CO₂, and by which processes? To which extend have the technologies already been developed and implemented in pilot, demonstration and commercial plants? Which companies are working on technologies to uses CO₂ as a feedstock? What are the trends in CO₂ utilisation in the coming years?
This report addresses the fuel, chemical and materials industries, brands, technology scouts, investors, and policy makers. The report provides 240 pages of information on CO₂ utilisation. All the 116 companies mentioned are described in detailed profiles.
DOI No.: https://doi.org/10.52548/HKBS8158
-
Cellulose Fibres Conference 2024 (Proceedings, PDF)
Markets & Economy, Policy, Sustainability & Health, Technology
2024-04
150 € ex. tax
Plus 19% MwSt.Press
release Add to
cartThe conference covered the entire value chain, from lignocellulose, chemical pulp, cellulose fibres such as rayon, viscose, modal or lyocell and new developments to a wide range of applications:
Textiles from renewable fibres, non-wovens such as wet wipes as well as new areas such as composites, hygiene, packaging or nanocellulose in the food industry. The conference offered deep insights into the promising future of cellulose fibres, which perfectly fits the current trends of circular economy, recycling and sustainable carbon cycles.The Cellulose Fibres Conference Proceedings (https://cellulose-fibres.eu, 13-14 March 2024, Cologne, hybrid) include all released conference presentations, the conference journal, sponsor documents, a Fiber2Fashion Knowledgepaper and the conference press release.
-
75 Downloads
2024-03
FREE
75
Downloads -
76 Downloads
2024-03
FREE
76
Downloads -
70 Downloads
2024-03
FREE
70
Downloads -
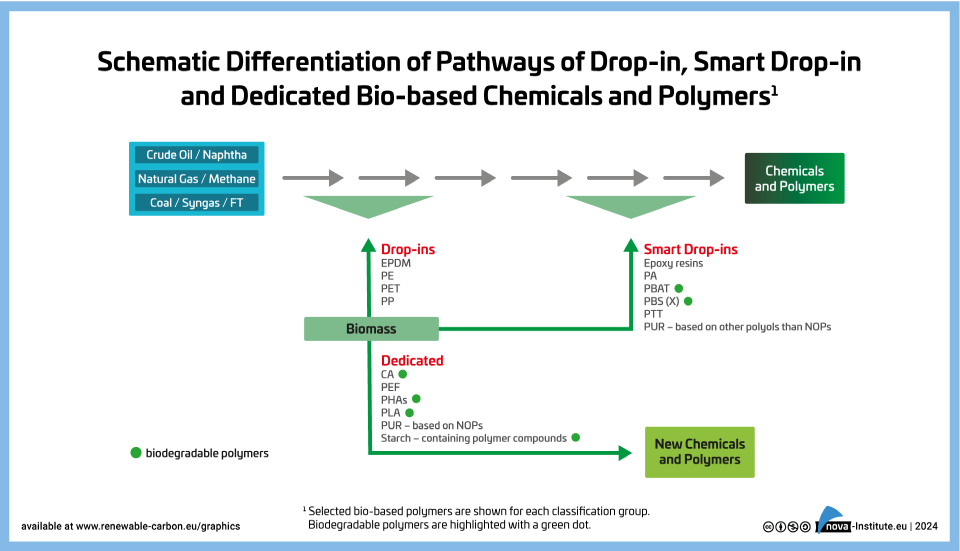
Schematic Differentiation of Pathways of Drop-in, Smart Drop-in and Dedicated Bio-based Chemicals and Polymers (PNG)
Markets & Economy
1 Page
41 Downloads41 Downloads
2024-03
FREE
41
Downloads -
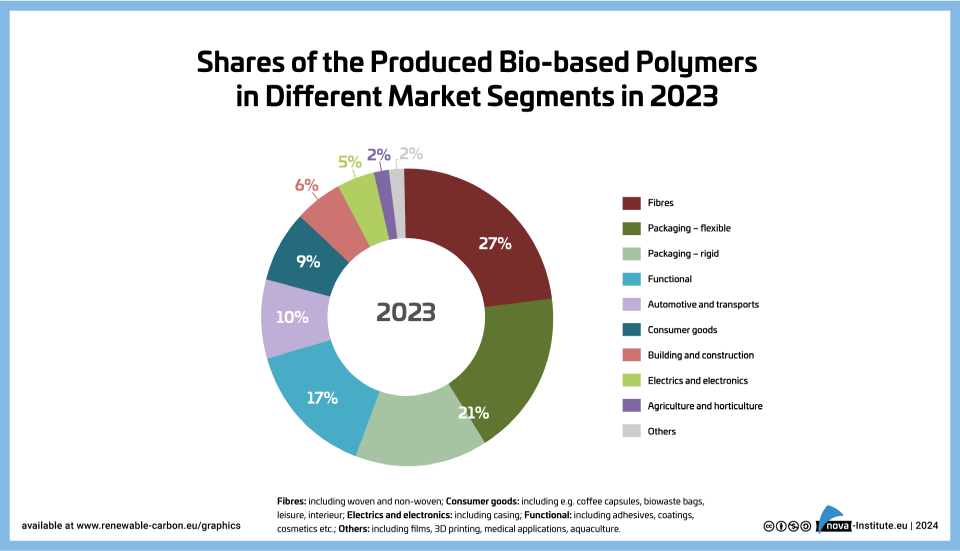
Shares of Produced bio-based polymers in different market segments (PNG)
Markets & Economy
1 Page
66 Downloads66 Downloads
2024-03
FREE
66
Downloads -
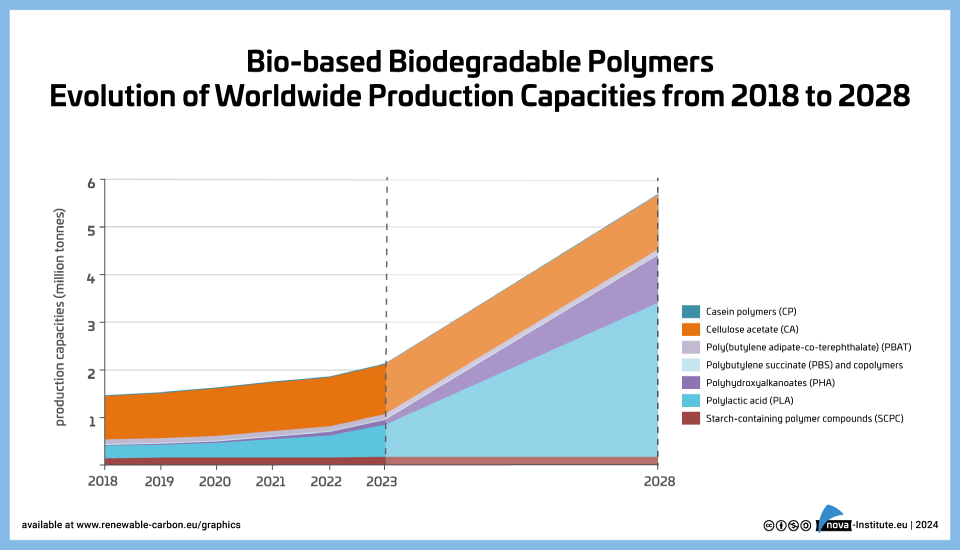
Bio-based Biodegradable Polymers Worldwide Production Capacities 2018-2028 (PNG)
Markets & Economy
1 Page
67 Downloads67 Downloads
2024-03
FREE
67
Downloads -
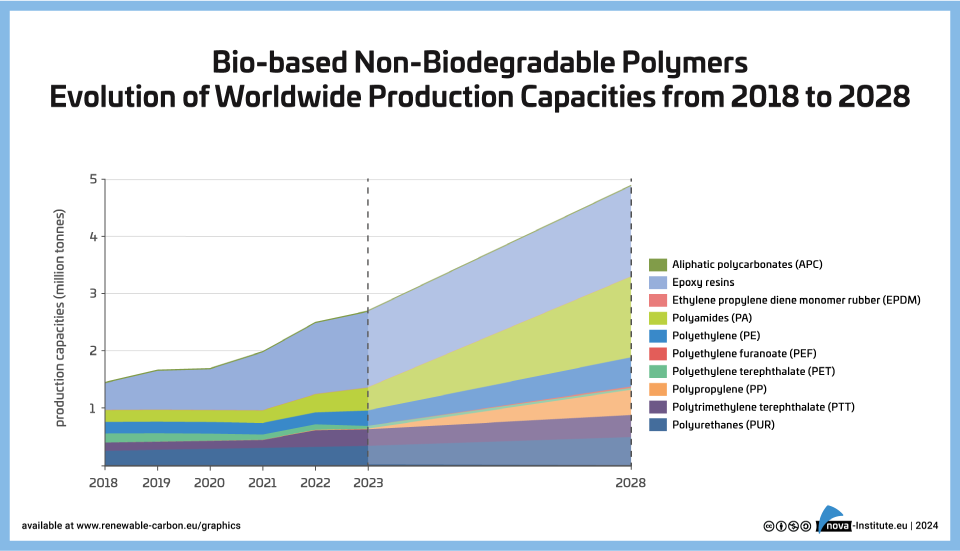
Bio-based Non-Biodegradable Polymers Evolution of Worldwide Production Capacities (PNG)
Markets & Economy
1 Page
38 Downloads38 Downloads
2024-03
FREE
38
Downloads -
50 Downloads
2024-03
FREE
50
Downloads -
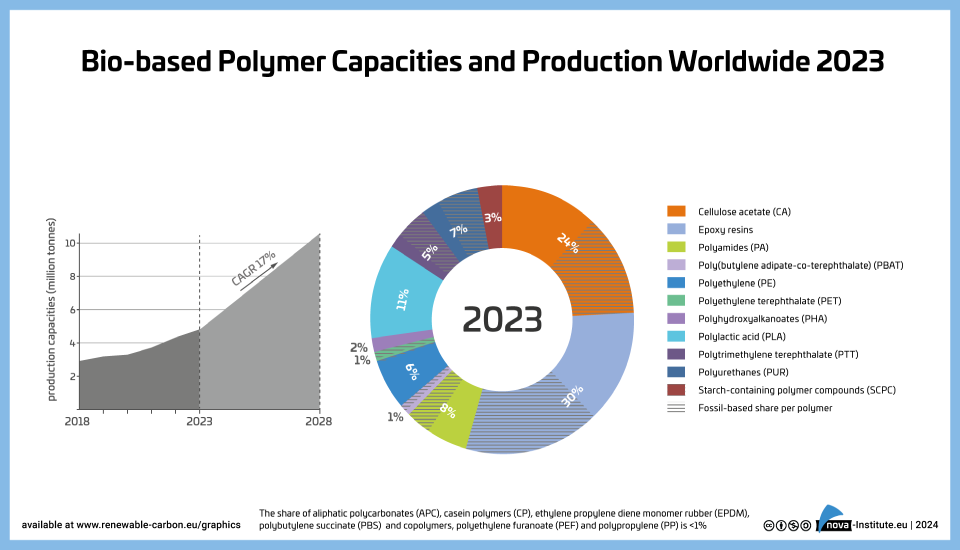
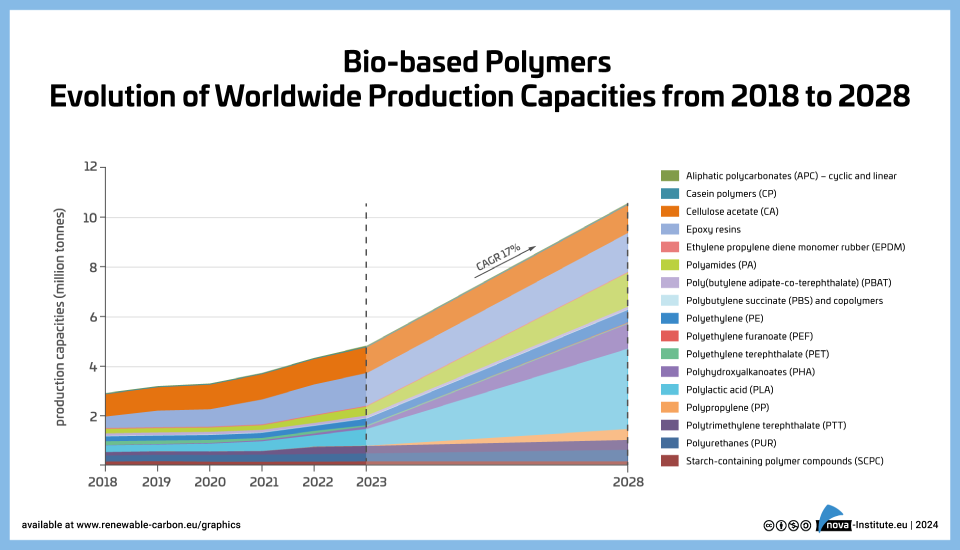
Bio-based Polymers – Evolution of worldwide production capacities from 2018 to 2028 (PNG)
Markets & Economy
1 Page
59 Downloads59 Downloads
2024-03
FREE
59
Downloads -
67 Downloads
2024-03
FREE
67
Downloads -
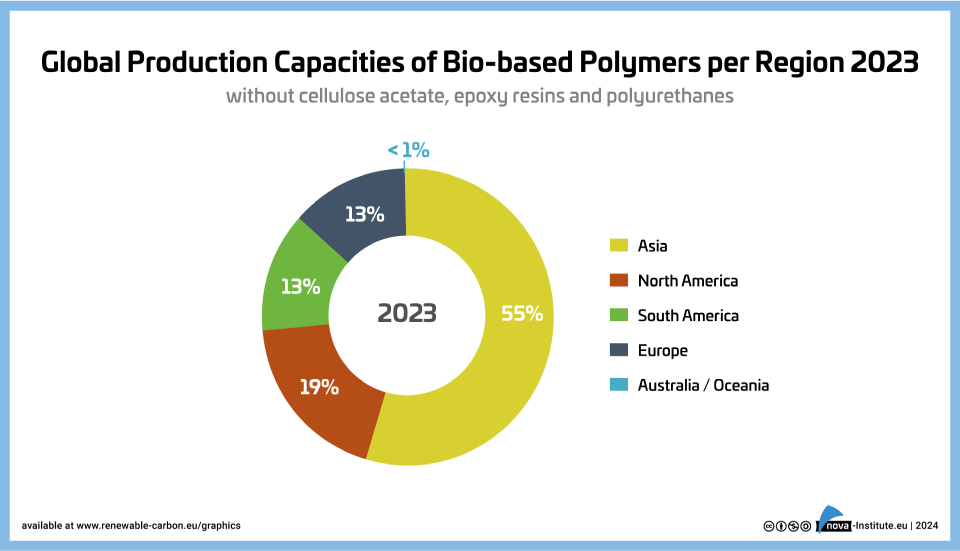
Global Production Capacities of Bio-based Polymers per Region 2022 (PNG)
Markets & Economy
1 Page
41 Downloads41 Downloads
2024-03
FREE
41
Downloads