
Showing 21–40 of 437
-
PEF – A Circular Bio-Based Plastic with Improved Properties and Environmental Performance (PDF)
Sustainability & Health, Technology
19 Pages
521 Downloads
-
-
-
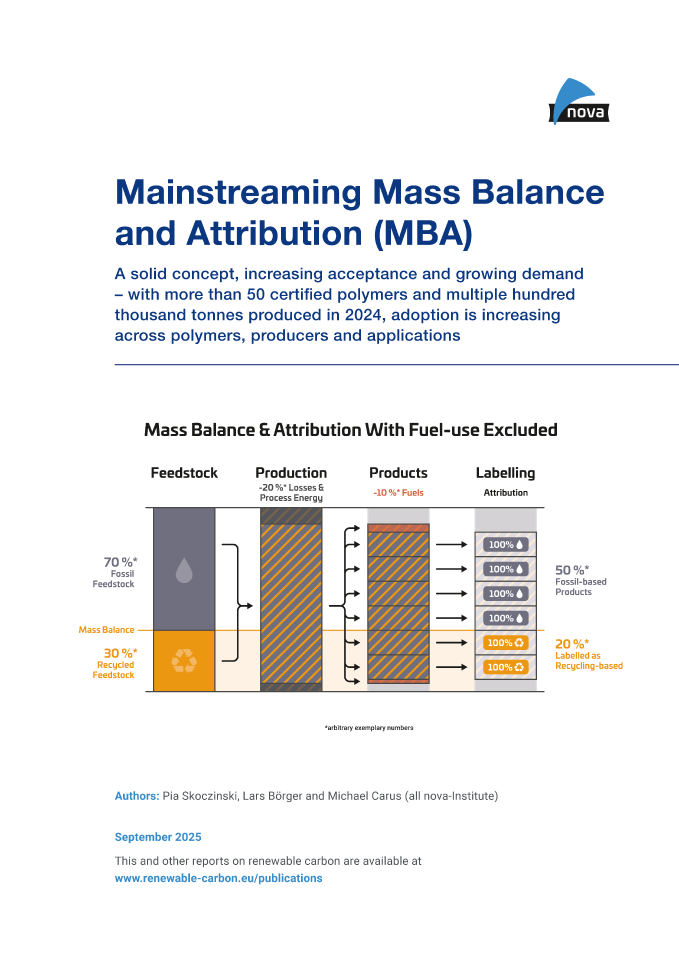
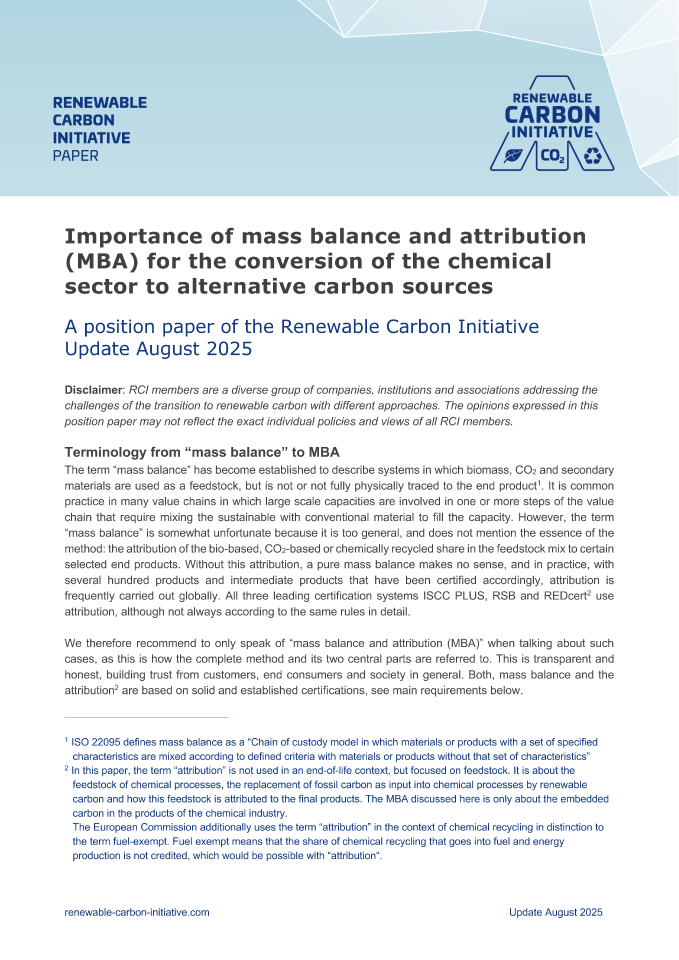
Importance of Mass Balance and Attribution (MBA) for the Conversion of the Chemical Sector to Alternative Carbon Sources: Update 2025 – RCI Position Paper (August 2025)
Markets & Economy, Policy
5 Pages
305 Downloads -
The fossil fuel trap: Why defossilising chemistry is essential – and feasible! (PDF)
Markets & Economy, Policy, Technology
8 Pages
253 Downloads -
Die fossile Falle: Warum die Defossilisierung der Chemie unverzichtbar – und machbar – ist! (PDF)
Markets & Economy, Policy, Technology
8 Pages
84 Downloads -
Summary of RCI Scientific Background Report “RCI Policy Proposals for Facilitating the Transition to Renewable Carbon” (PDF)
Markets & Economy, Sustainability & Health
3 Pages
451 Downloads -
3-CO Social Innovation Brochure: Social Innovation – Solutions Contributing to Responsible Production and Consumption in the Bioeconomy and Beyond
Sustainability & Health
64 Pages
459 Downloads -
-
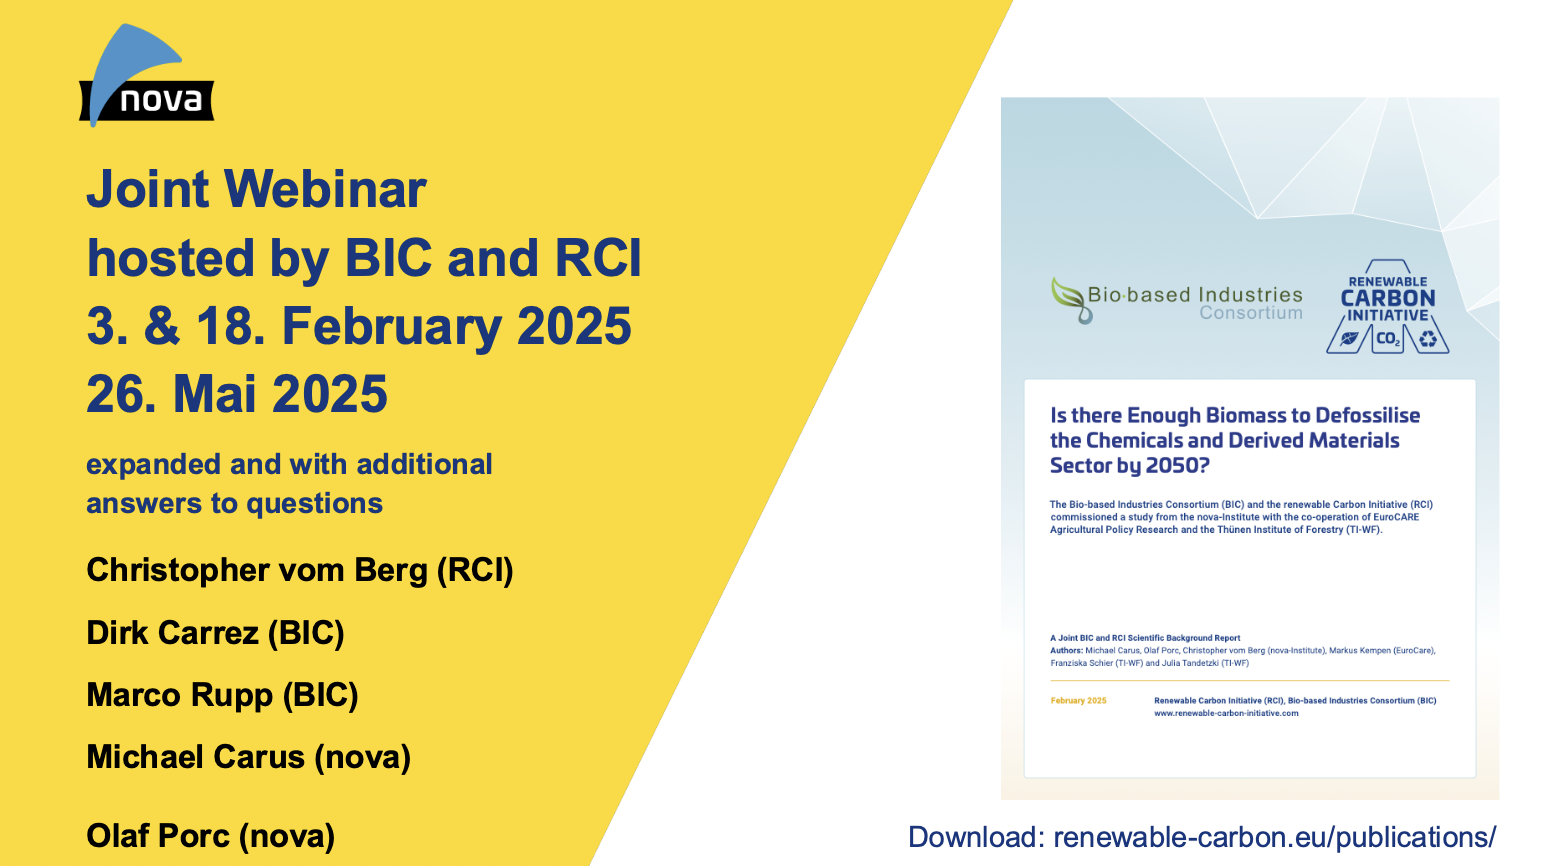
Joint Webinar hosted by Bio-based Industries Consortium (BIC) and the Renewable Carbon Initiative (RCI) (May 2025) (PDF)
Policy, Sustainability & Health
51 Pages
844 Downloads -
CO2-based Fuels and Chemicals Conference 2025 (Proceedings, PDF)
Markets & Economy, Policy, Sustainability & Health, Technology
-
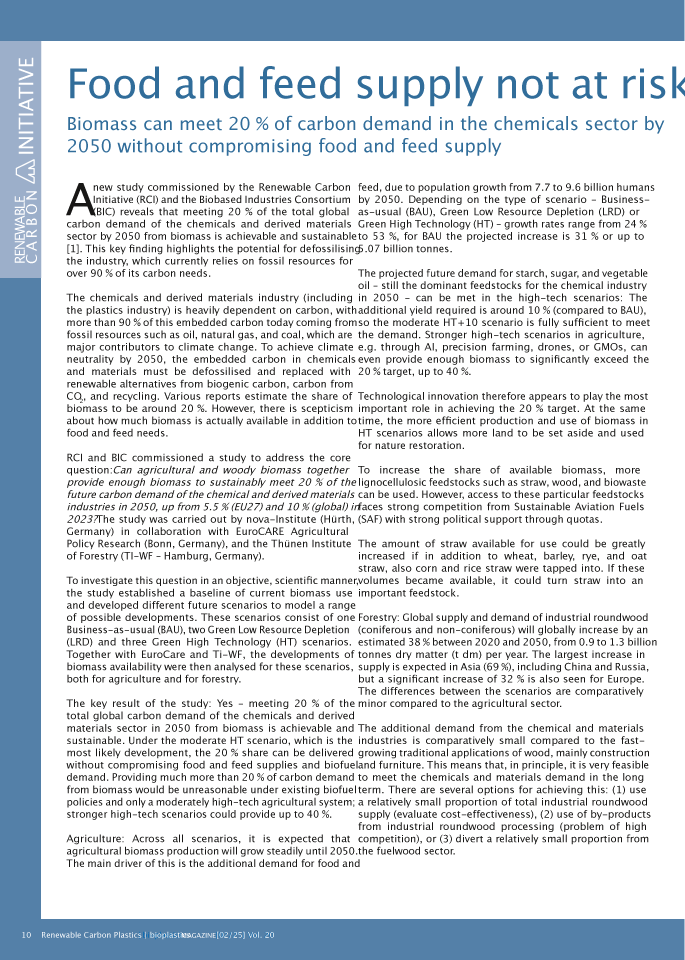
Summary of BIC/RCI Report – Food and feed supply not at risk (PDF)
Sustainability & Health
3 Pages
481 Downloads -
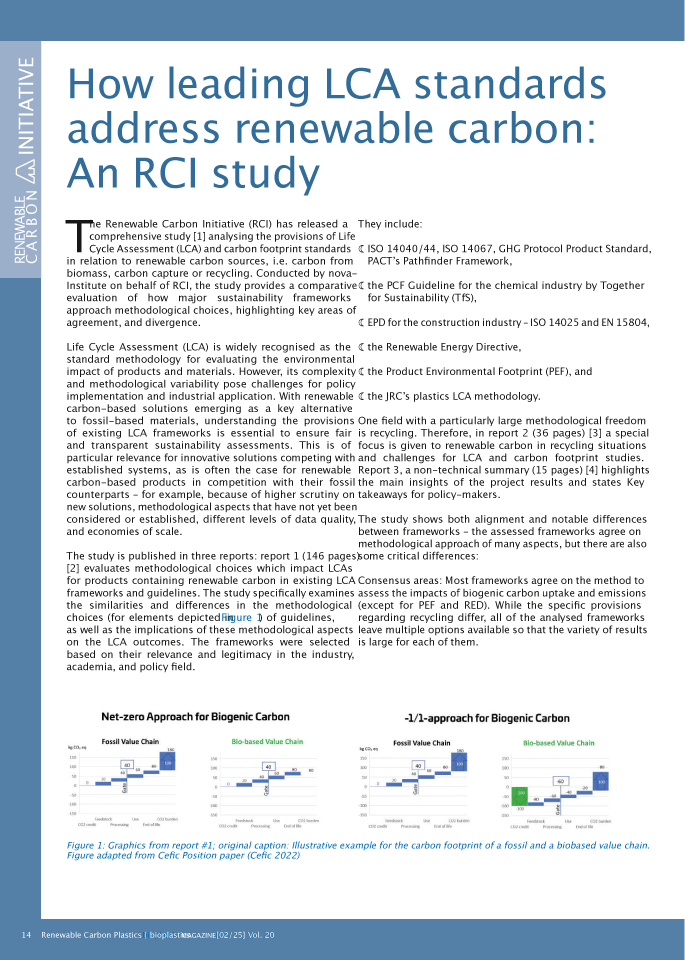
Summary of RCI Scientific Background Report “Evaluating LCA Approaches and Methodoloies for Renewable Carbon Sources” (PDF)
Sustainability & Health
3 Pages
609 Downloads -
RCI Webinar: LCA Approaches and Methodologies for Renewable Carbon (PDF)
Sustainability & Health
54 Pages
740 Downloads -
A Deep Dive into the Forestry sector – „Is There Enough Biomass to Defossilise the Chemicals and Derived Materials Sector by 2050?” (PDF)
Markets & Economy, Policy, Sustainability & Health
46 Pages
607 Downloads -
Background Document to RCI/BIC Report „Measuring the Use of Biogenic Feedstocks in the Global and EU Chemical Industry in 2023″ (PDF)
Markets & Economy, Policy
16 Pages
128 Downloads -
A Deep Dive into the Agriculture sector – „Is There Enough Biomass to Defossilise the Chemicals and Derived Materials Sector by 2050?“ (PDF)
Markets & Economy, Policy, Sustainability & Health
41 Pages
636 Downloads -
Policy Proposals for Facilitating the Transition to Renewable Carbon – RCI Report (April 2025)
Markets & Economy, Policy, Sustainability & Health, Technology
70 Pages
1379 Downloads