 Advanced Recycling Conference 2024 (Proceedings) [Digital]
 Showing 21–40 of 235
-
-
Cellulose Fibres Conference 2025 (Proceedings, PDF)
Markets & Economy, Policy, Sustainability & Health, Technology

-
Evaluating LCA Approaches and Methodologies for Renewable Carbon Sources Report 1 of 3 – Renewable Carbon in LCA Guidelines (March 2025) (PDF)
Markets & Economy, Policy, Sustainability & Health
145 Pages
982 Downloads -
Evaluating LCA Approaches and Methodologies for Renewable Carbon Sources Report 2 of 3 – Renewable Carbon in Recycling Situations (March 2025) (PDF)
Markets & Economy, Policy, Sustainability & Health
37 Pages
679 Downloads -
Evaluating LCA Approaches and Methodologies for Renewable Carbon Sources Report 3 of 3 – Non-technical Summary (March 2025) (PDF)
Markets & Economy, Policy, Sustainability & Health
15 Pages
876 Downloads -
Core Elements of LCA for Renewable Carbon Solutions (PNG)
Policy, Sustainability & Health
1 Page
116 Downloads -
Bio-based Polymers Worldwide (PDF)
Markets & Economy, Policy, Sustainability & Health
5 Pages
805 Downloads -
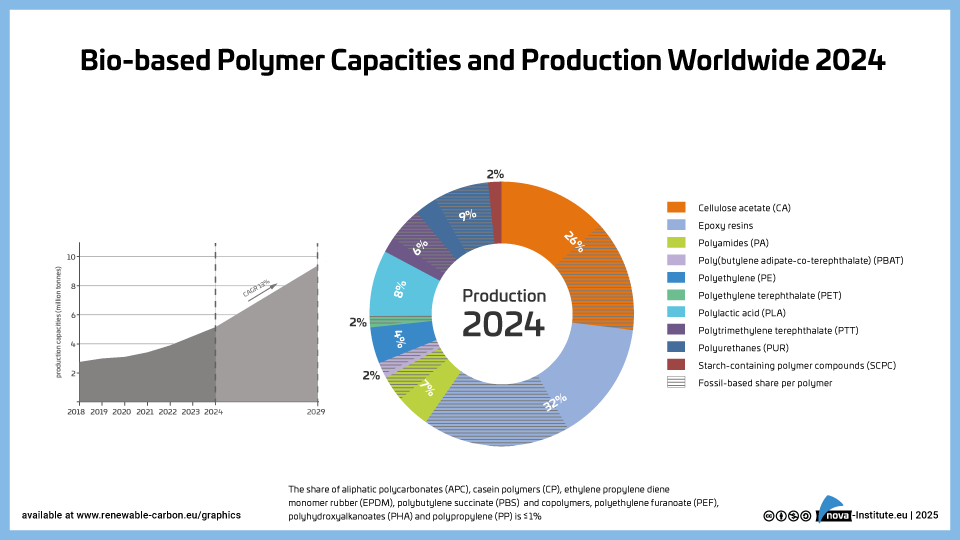
Bio-based-Polymer-Production-and-Bio-based-shares-2024 (PNG)
Markets & Economy, Policy, Sustainability & Health
1 Page
179 Downloads -
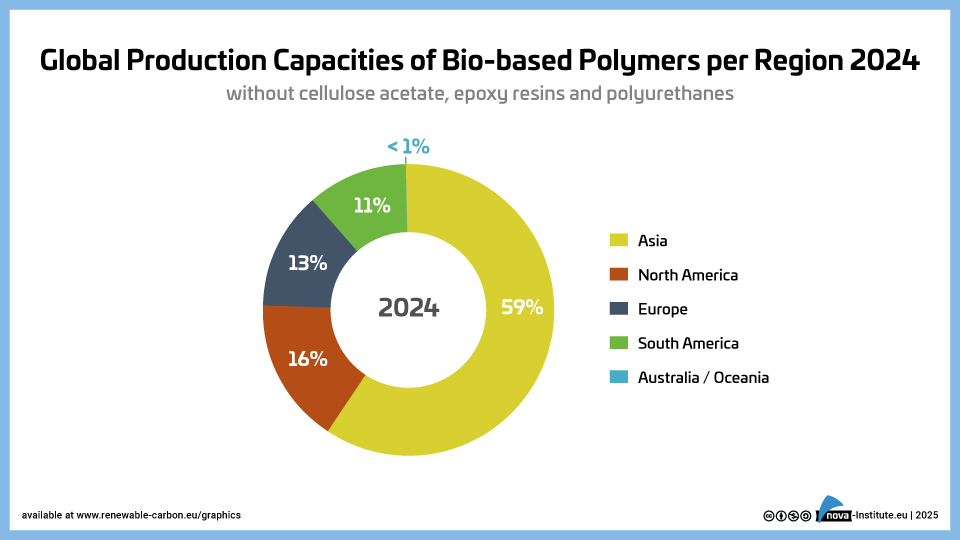
Global-Production-Capacities-of-Bio-based-Polymers-per-Region-2024 (PNG)
Markets & Economy, Policy, Sustainability & Health
1 Page
40 Downloads -
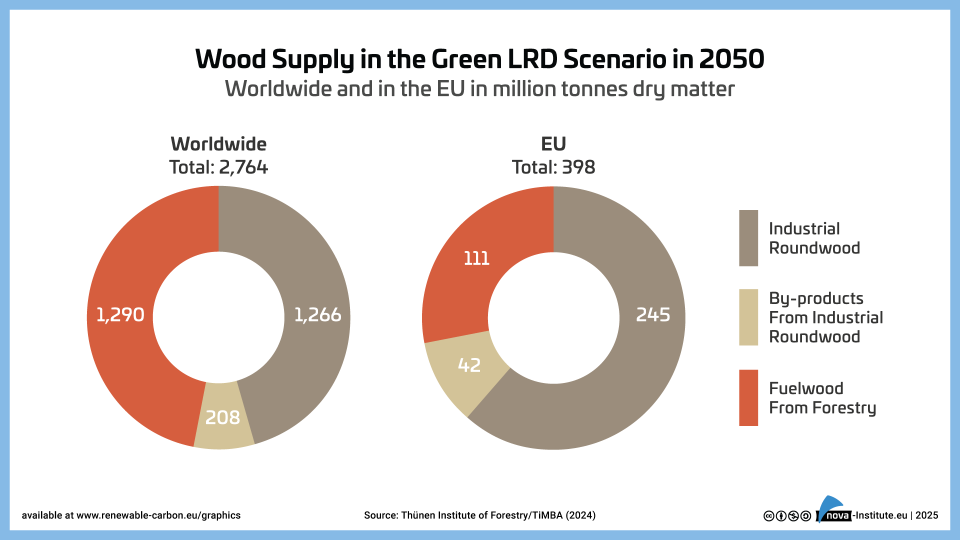
Wood Supply in the Green LRD Scenario in 2050 – Graphic (PNG)
Markets & Economy, Policy, Sustainability & Health
1 Page
9 Downloads -
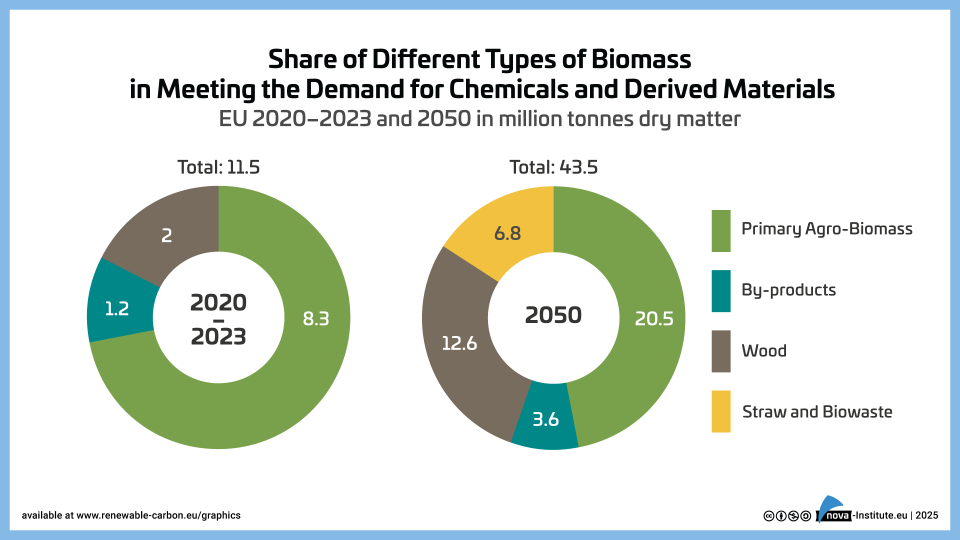
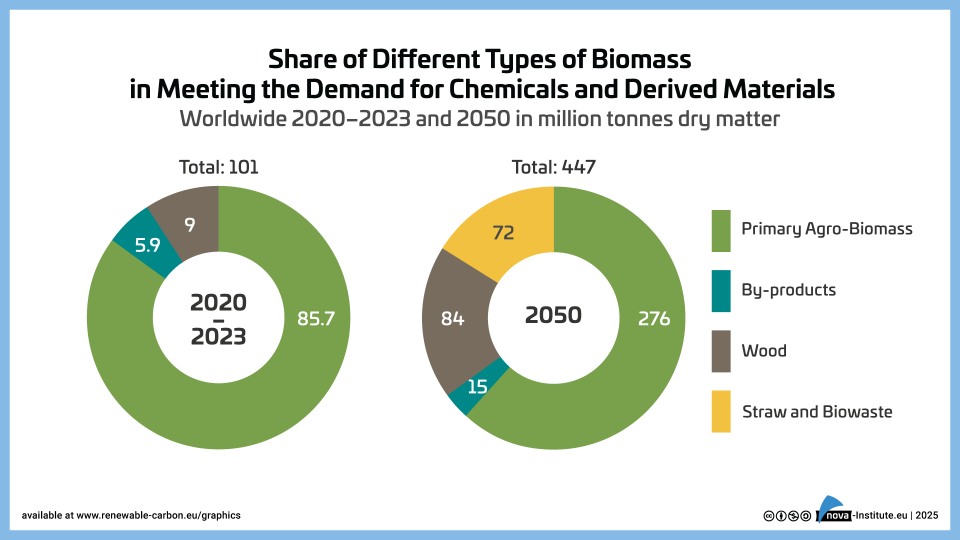
Share of Different Types of Biomass Worldwide 2023-2050 – Graphic (PNG)
Markets & Economy, Policy, Sustainability & Health
1 Page
58 Downloads -
Share-of-Different-Types-of-Biomass-EU-2023–2050 – Graphic (PNG)
Markets & Economy, Policy, Sustainability & Health
1 Page
31 Downloads -
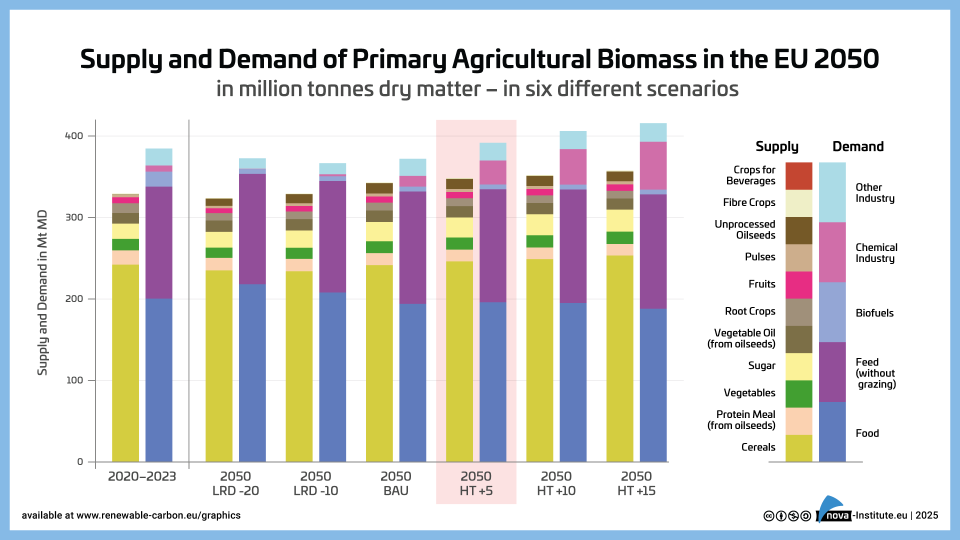
Supply and Demand of Agriculture Biomass in the EU 2050 – Graphic (PNG)
Markets & Economy, Policy, Sustainability & Health
1 Page
32 Downloads -
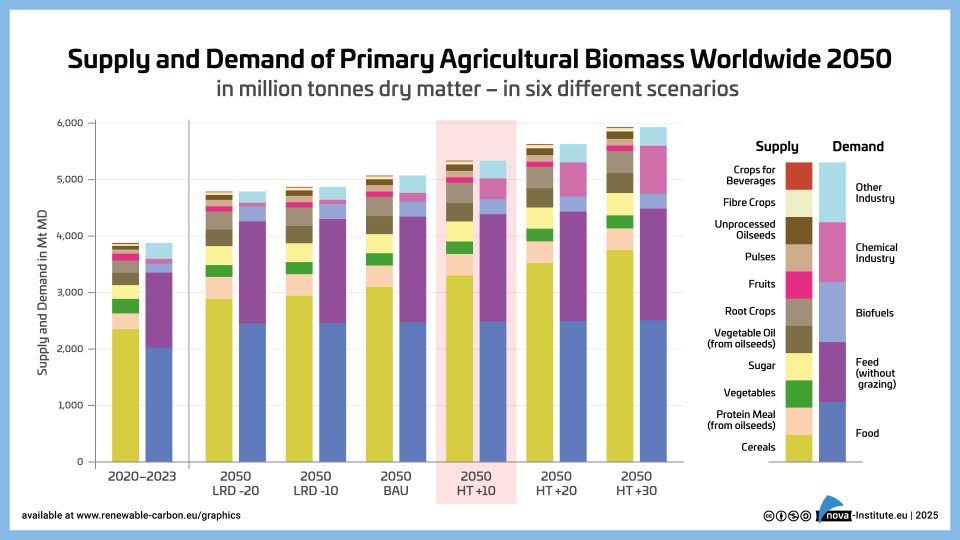
Supply and Demand of Agriculture Biomass Worldwide 2050 – Graphic (PNG)
Markets & Economy, Policy, Sustainability & Health
1 Page
37 Downloads -
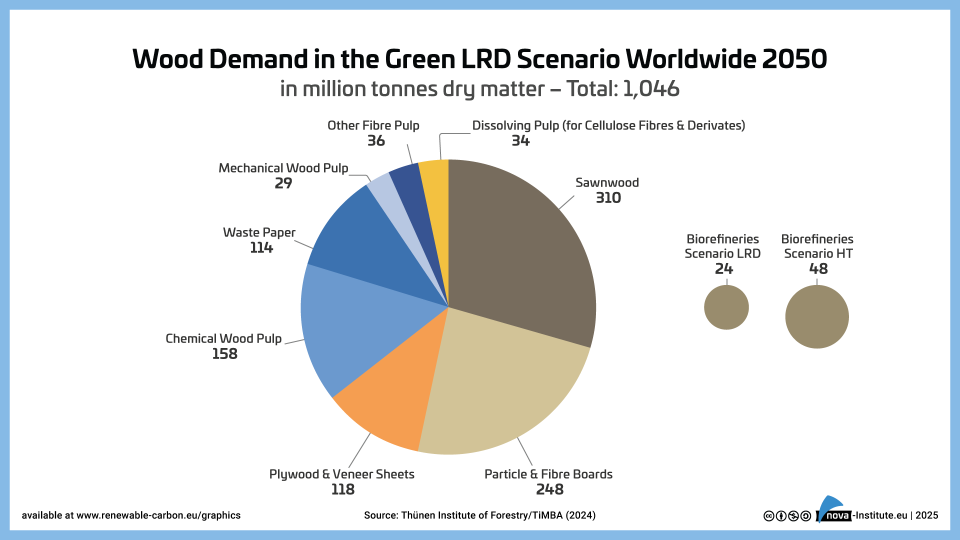
Wood Demand in the Green LRD Scenario Worldwide 2050 – Graphic (PNG)
Markets & Economy, Policy, Sustainability & Health
1 Page
14 Downloads -
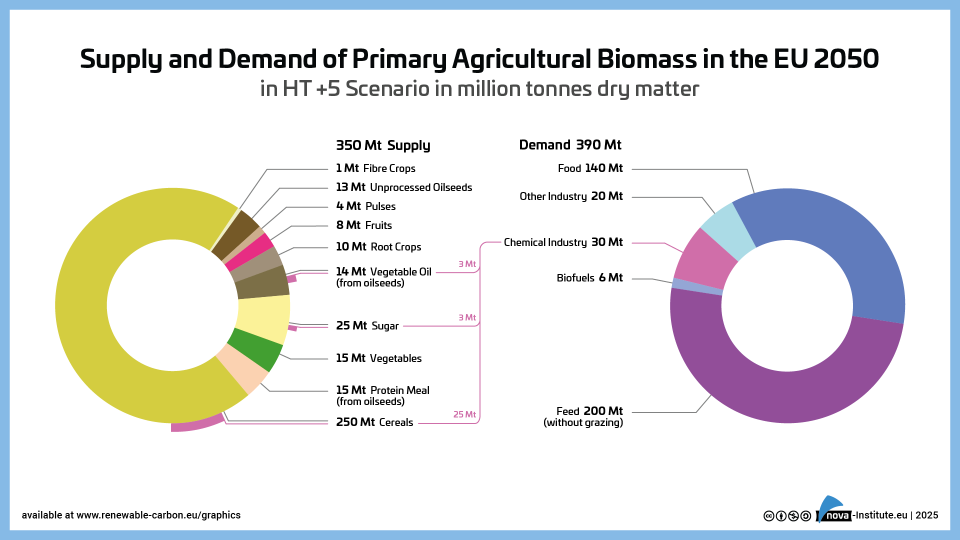
Supply and Demand of Agricultural Biomass in the EU 2050 in HT +5 Scenario – Graphic (PNG)
Markets & Economy, Policy, Sustainability & Health
1 Page
25 Downloads -
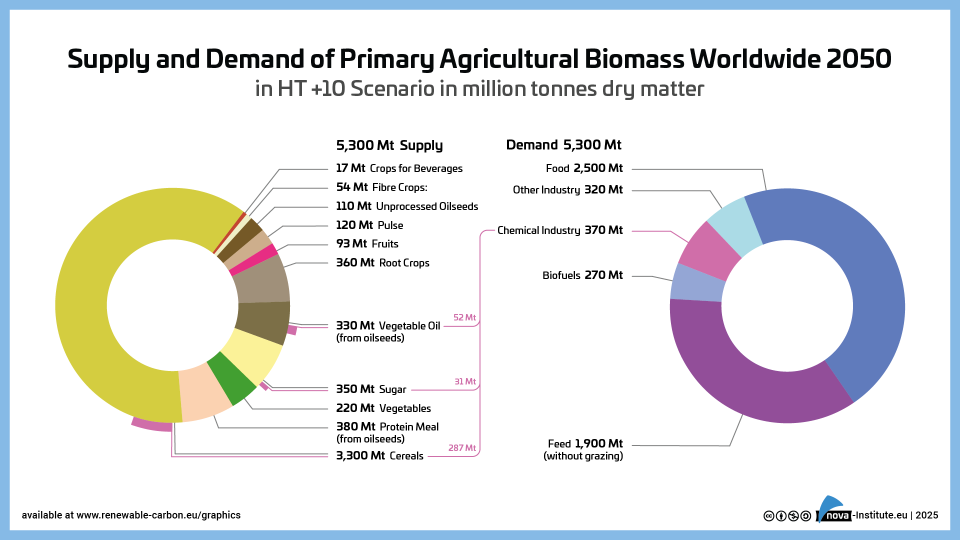
Supply and Demand of Agricultural Biomass Worldwide 2050 in HT +10 Scenario – Graphic (PNG)
Markets & Economy, Policy, Sustainability & Health
1 Page
38 Downloads -
Is there Enough Biomass to Defossilise the Chemicals and Derived Materials Sector by 2050? – A Joint BIC and RCI Scientific Background Report (PDF)
Markets & Economy, Policy, Sustainability & Health
41 Pages
1852 Downloads -
EU and Global: Biomass Demand for Transport Fuels, Aviation and Shipping up to 2050 and Implications for Biomass Supply to the Chemical Sector (PDF)
Markets & Economy, Policy, Sustainability & Health
44 Pages
1270 Downloads -
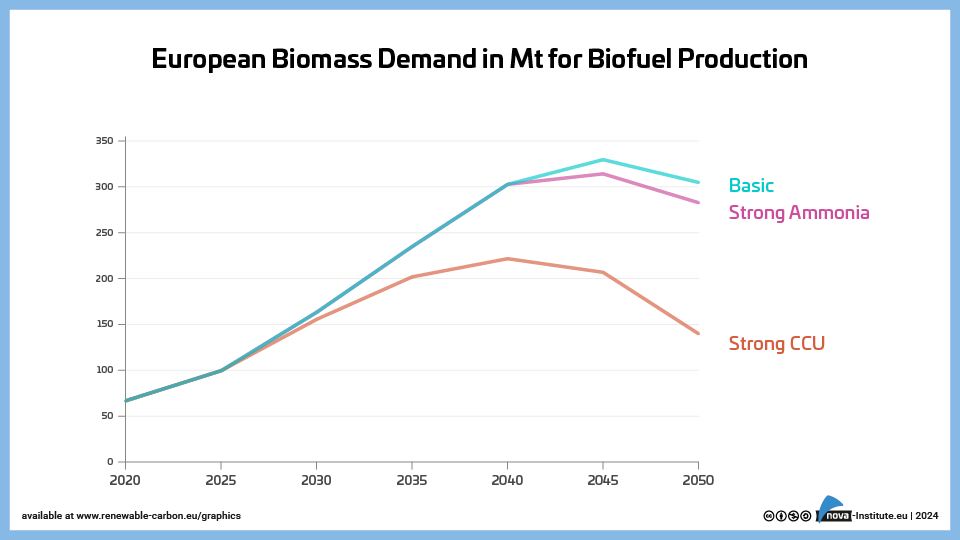
European Biomass Demand in Mt for Biofuel Production – Graphic (PNG)
Markets & Economy, Policy, Sustainability & Health
1 Page
31 Downloads
![Cellulose Fibres Conference 2025 (Proceedings, PDF) [Digital]](https://renewable-carbon.eu/publications/wp-content/uploads/2020/05/21-01-07_RC-Publications-Cover-Proceedings_Cellulose-Fibres-100x141.png)