Showing 121–140 of 158
-
-
Renewable Carbon Initiative (RCI) draws worldwide attention (PDF)
Policy, Sustainability & Health
2 Pages
294 Downloads
-
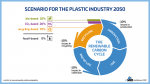
Scenario for the Plastic Industry 2050 (PNG)
Markets & Economy, Policy, Sustainability & Health, Technology
1 Page
1566 Downloads -
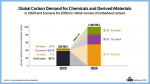
Global Carbon Demand for Chemicals and Derived Materials (PNG)
Markets & Economy, Policy, Sustainability & Health, Technology
1 Page
1384 Downloads -
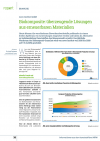
Biokomposite: überzeugende Lösungen aus erneuerbaren Materialien
Markets & Economy, Technology
3 Pages
435 Downloads
-
The Renewable Carbon Initiative – A new movement draws worldwide attention NORA and her FlyPhone on Renewable Carbon
Policy, Sustainability & Health
3 Pages
314 Downloads -
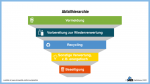
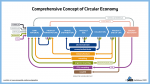
Comprehensive Concept of a Circular Economy (PNG)
Policy, Sustainability & Health
1 Page
965 Downloads -
nova-paper #15: A Tax on Fossil Carbon is More Effective Than a Tax on CO2 Emissions
Policy
12 Pages
726 Downloads -
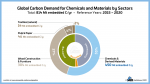
Global Carbon Demand for Chemicals and Materials by Sectors (PDF)
Sustainability & Health
1 Page
552 Downloads -
Global Carbon Demand for Chemicals and Materials by Sectors (PNG)
Sustainability & Health
1 Page
362 Downloads -
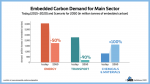
Embedded Carbon Demand for Main Sector – Today and 2050 (PNG)
Sustainability & Health
1 Page
207 Downloads -
Embedded Carbon Demand for Main Sector – Today and 2050 (PDF)
Sustainability & Health
1 Page
249 Downloads -
Renewable Materials Conference, 18-20 May 2021 (Proceedings)
Markets & Economy, Policy, Sustainability & Health
209 Downloads -
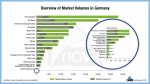
BioSinn Applications – Overview of Market Volumes in Germany (PNG)
Markets & Economy
1 Page
175 Downloads -
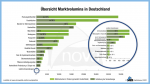
BioSinn Produkte / Anwendungen – Übersicht der Marktvolumina in Deutschland (PNG)
Markets & Economy
1 Page
192 Downloads -
-
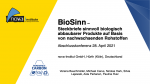
BioSinn Präsentation Abschlusskonferenz 28. April 2021 (deutsch) (PDF)
Markets & Economy, Policy
141 Pages
310 Downloads -
BioSinn Presentation Final Conference 30 April 2021 (PDF)
Markets & Economy, Policy
141 Pages
442 Downloads -
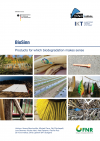
BioSinn – Products for which biodegradation makes sense (PDF)
Markets & Economy, Policy
134 Pages
2674 Downloads -
![Renewable Materials Conference, 18-20 May 2021 (Proceedings) [Digital]](https://renewable-carbon.eu/publications/wp-content/uploads/2020/05/21-01-07_RC-Publications-Cover-Proceedings_RMC-100x141.png)