
Showing 81–100 of 194
-
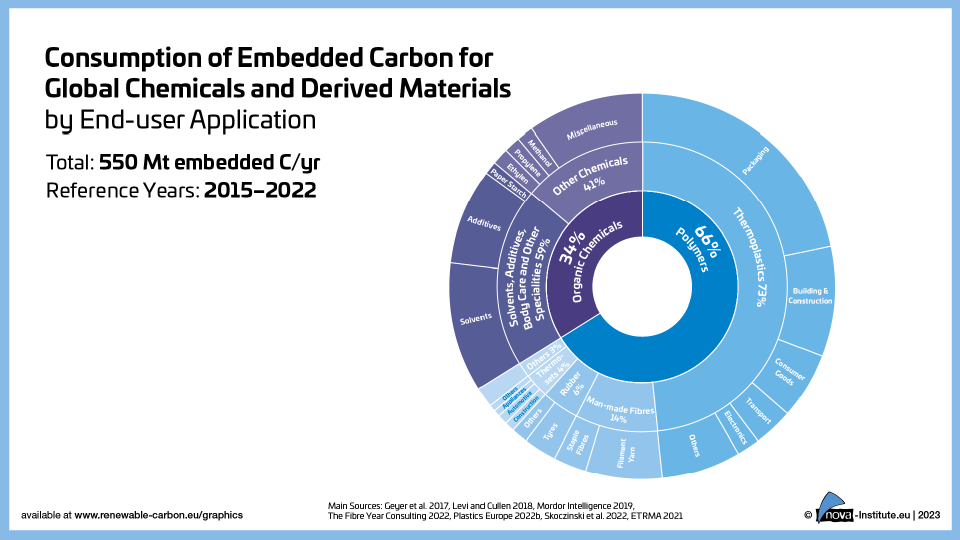
Consumption of Embedded Carbon for Global Chemicals and Derived Materials by End-user Application (PNG)
Markets & Economy, Policy
1 Page
118 Downloads
-
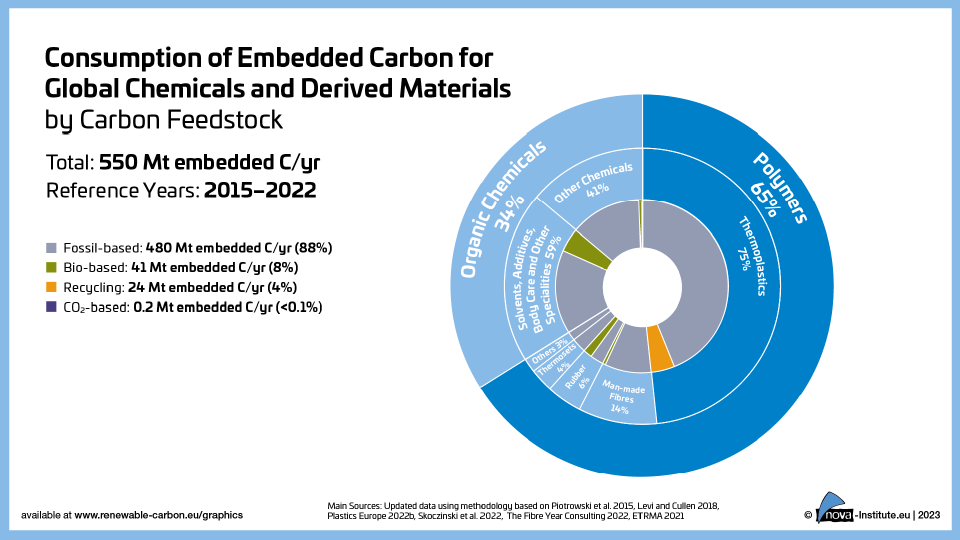
Consumption of Embedded Carbon for Global Chemicals and Derived Materials by Carbon Feedstock (PNG)
Markets & Economy, Policy
1 Page
115 Downloads -
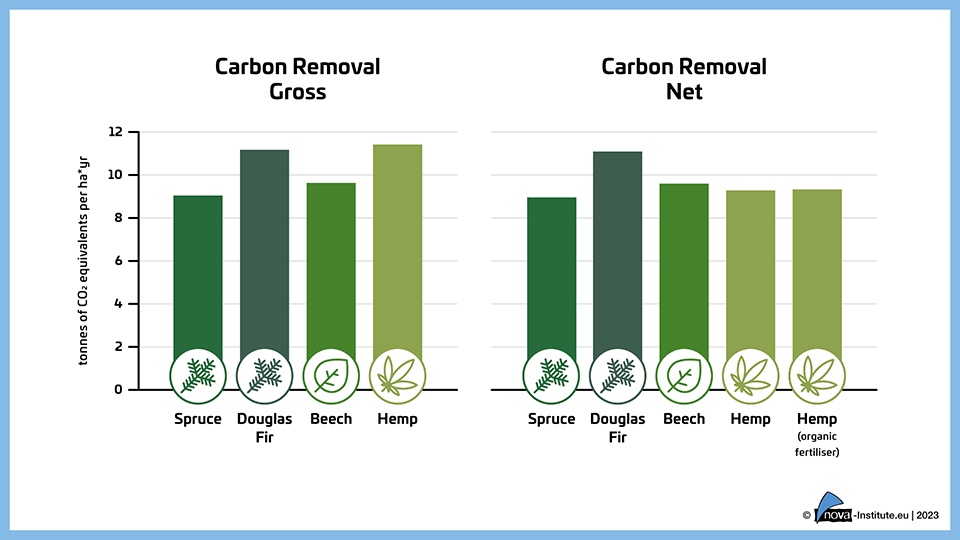
Gross and net carbon removal of hemp and wood per hectare and year (PNG)
Sustainability & Health
1 Page
82 Downloads -
-
-
-
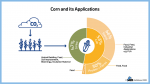
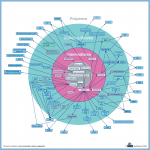
Corn and its Applications (PNG)
Markets & Economy, Policy, Sustainability & Health, Technology
1 Page
123 Downloads -
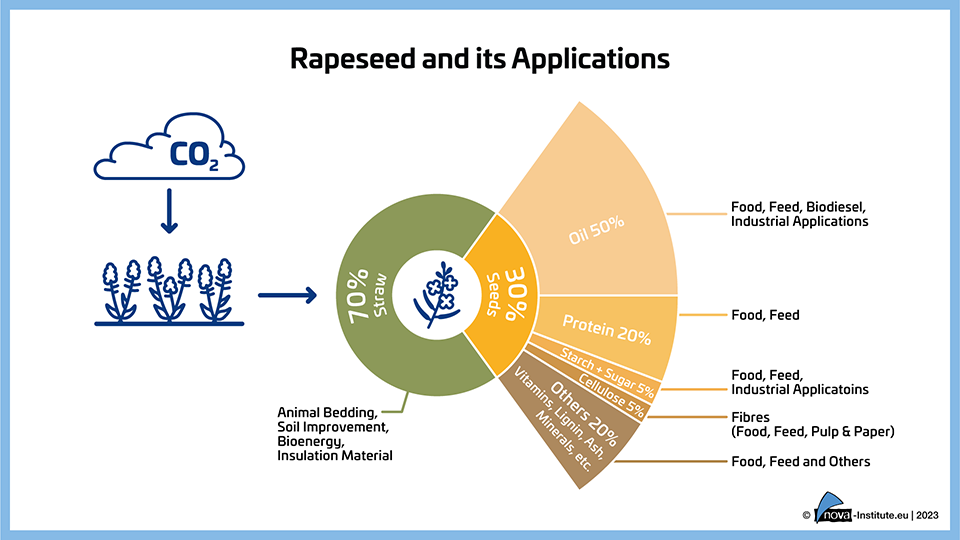
Rapeseed and its Applications (PNG)
Markets & Economy, Policy, Sustainability & Health, Technology
1 Page
95 Downloads -
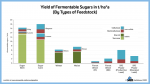
Yield of Fermentable Sugars (PNG)
Markets & Economy, Policy, Sustainability & Health, Technology
1 Page
148 Downloads -
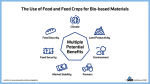
Graphic of the scientific paper „The Use of Food and Feed Crops for Bio-based Materials and the Related Effects on Food Security“ (PNG)
Markets & Economy, Policy, Sustainability & Health, Technology
1 Page
113 Downloads -
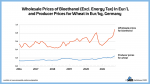
Wholesale Prices of Bioethanol and Wheat (PNG)
Markets & Economy, Policy, Sustainability & Health, Technology
1 Page
84 Downloads -
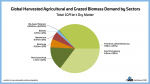
Global Harvested Agricultural and Grazed Biomass Demand by Sectors (PNG)
Markets & Economy, Policy, Sustainability & Health, Technology
1 Page
147 Downloads -
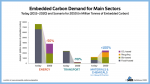
Embedded Carbon Demand for Main Sector (PNG)
Markets & Economy, Policy, Sustainability & Health, Technology
1 Page
139 Downloads -
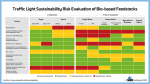
Traffic Light Sustainability Risk Evaluation of Bio-based Feedstocks (PNG)
Markets & Economy, Policy, Sustainability & Health, Technology
1 Page
292 Downloads -
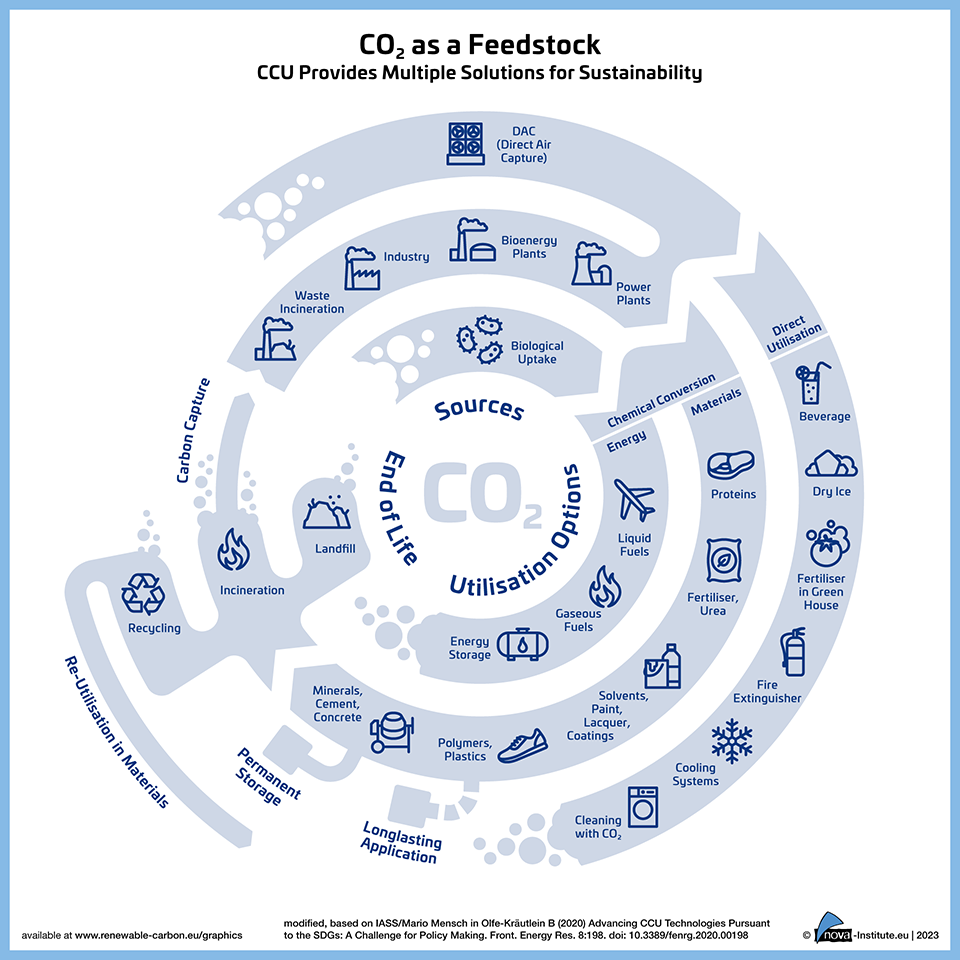
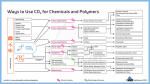
Ways to Use CO₂ for Chemicals and Polymers – Graphic (PNG)
Markets & Economy, Technology
1 Page
1059 Downloads -
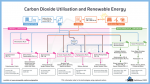
Carbon Dioxide Utilisation and Renewable Energy − Graphic (PNG)
Markets & Economy, Technology
1 Page
1502 Downloads -
-
-
Shares of the produced bio-based polymers in different market sements in 2022 (PNG)
Markets & Economy
1 Page
309 Downloads -