Showing 81–100 of 215
-
-
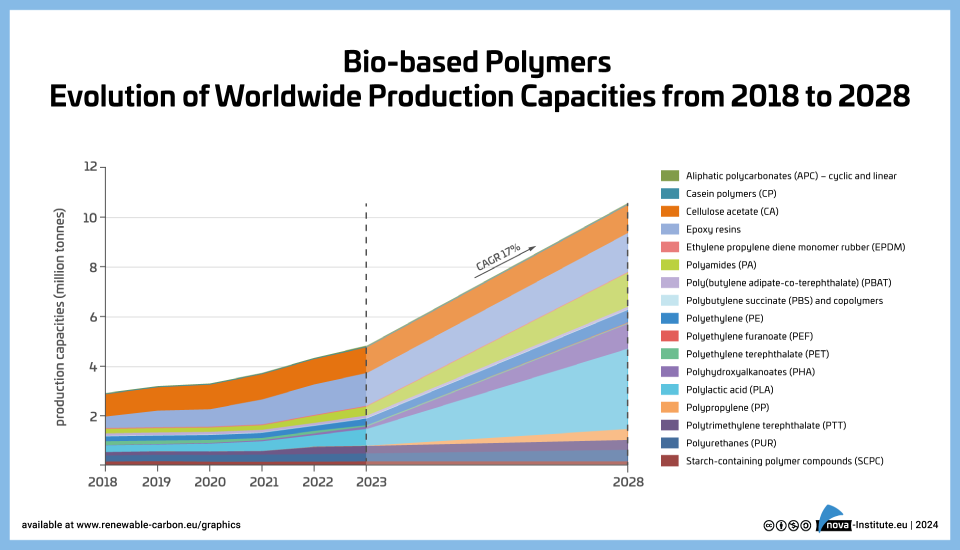
Bio-based Polymers – Evolution of worldwide production capacities from 2018 to 2028 (PNG)
Markets & Economy
1 Page
286 Downloads
-
-
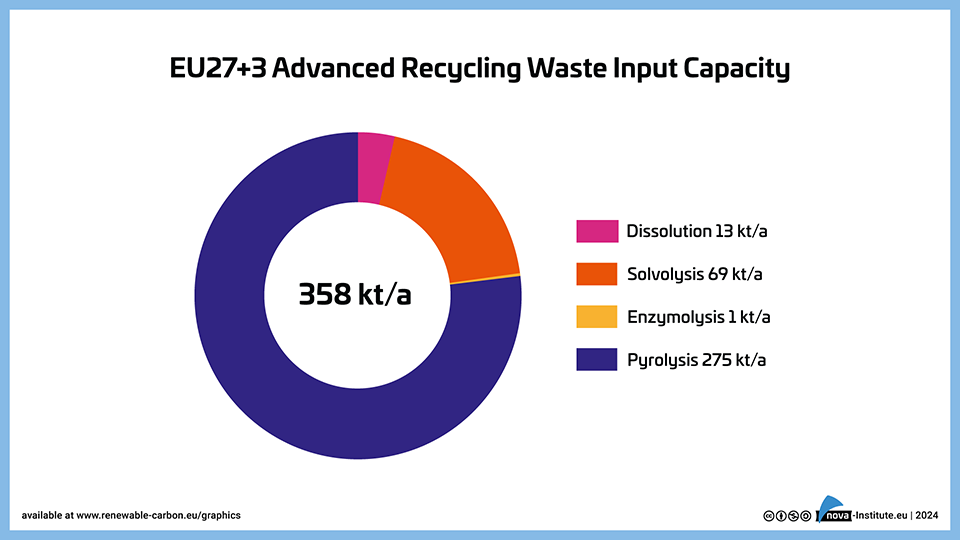
EU27+3 Advanced Recycling Waste Input Capacity (PNG)
Markets & Economy, Technology
1 Page
139 Downloads -
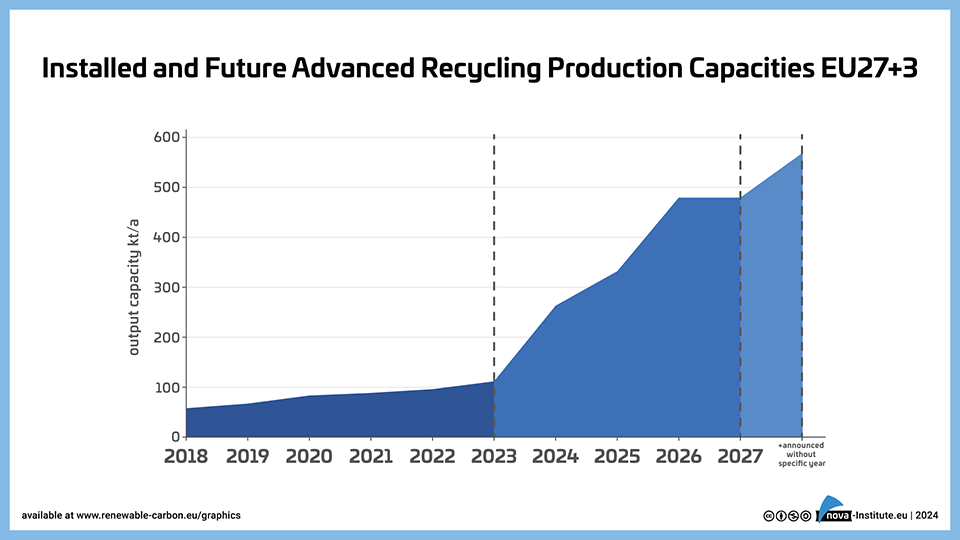
Installed and Future Advanced Recycling Production Capacities EU 27+3 (PNG)
Markets & Economy, Technology
1 Page
182 Downloads -
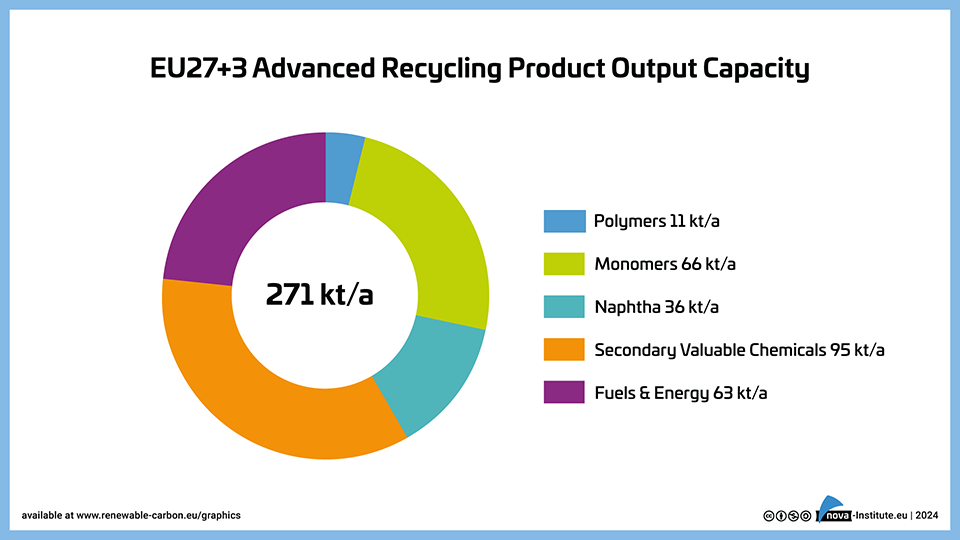
EU27+3 Advanced Recycling Product Output Capacity (PNG)
Markets & Economy, Technology
1 Page
136 Downloads -
-
Nora and her flyphone on renewable carbon (Comic)
Policy, Sustainability & Health
2 Pages
856 Downloads
-
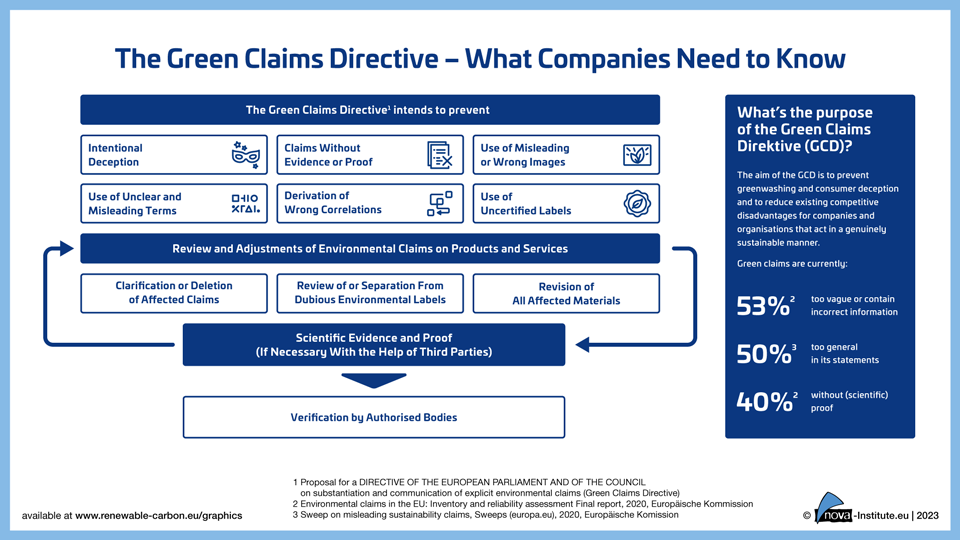
The Green-Claims-Directive – What Companies Need to Know (PNG)
Policy, Sustainability & Health
1 Page
535 Downloads -
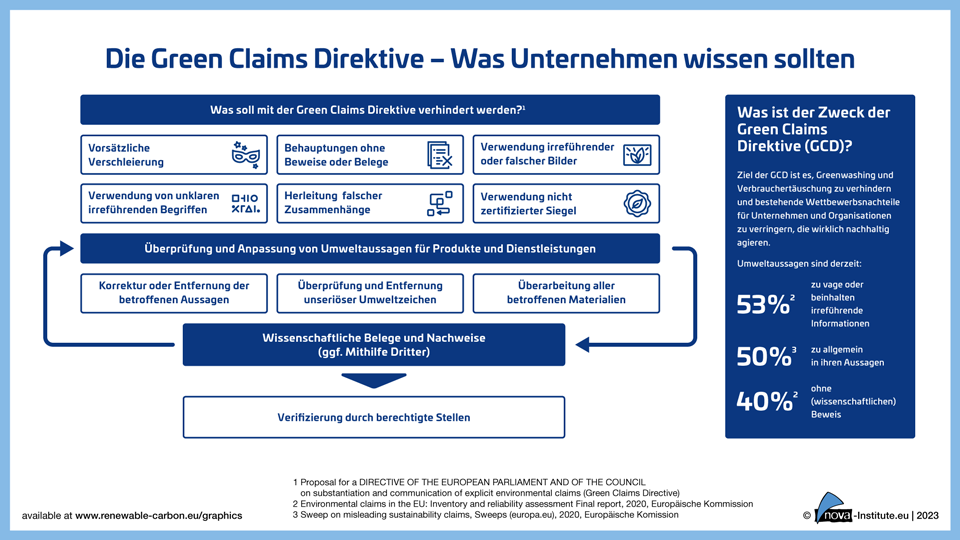
The Green-Claims-Directive – Was Unternehmen wissen sollten (PNG)
Policy, Sustainability & Health
1 Page
182 Downloads -
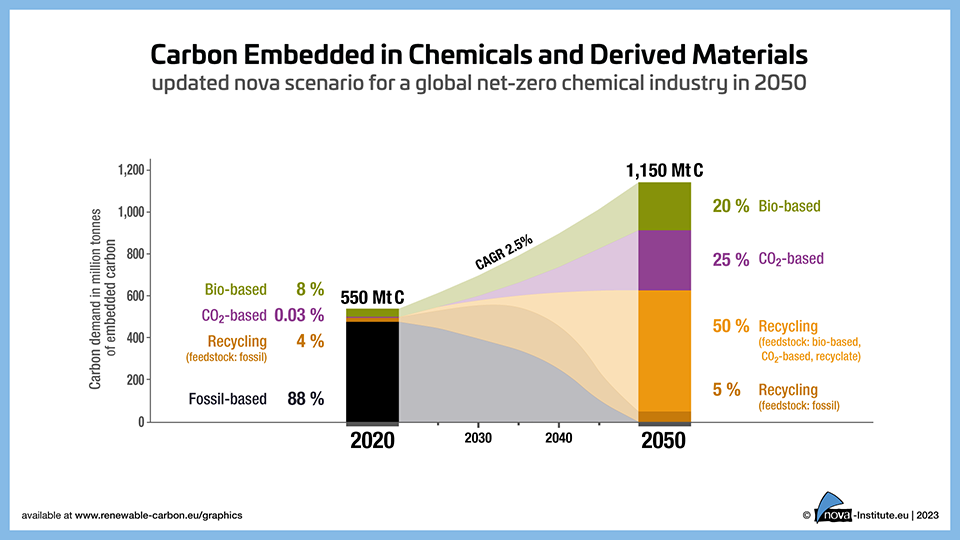
Explorative Scenario – Carbon Embedded in Chemicals and Derived Materials (PNG)
Markets & Economy, Policy
1 Page
1218 Downloads -
-
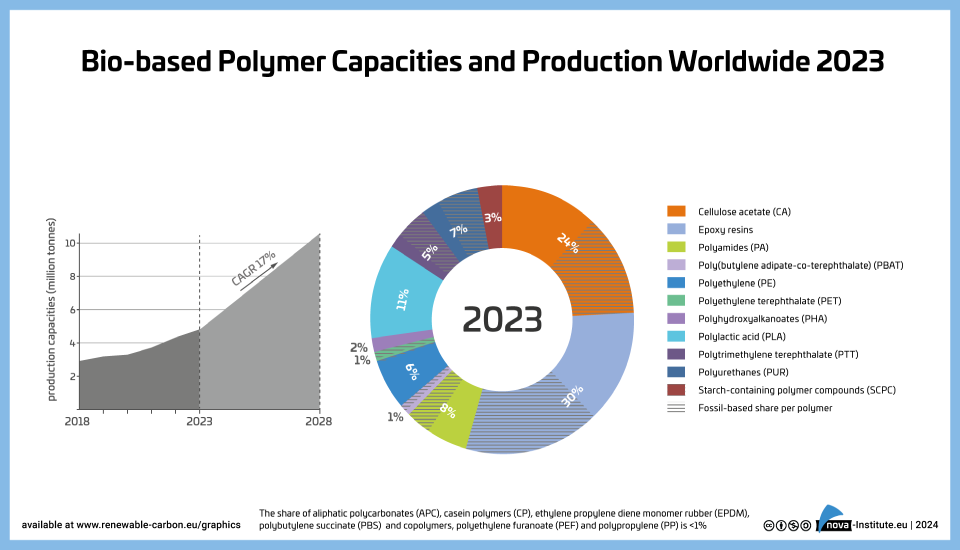
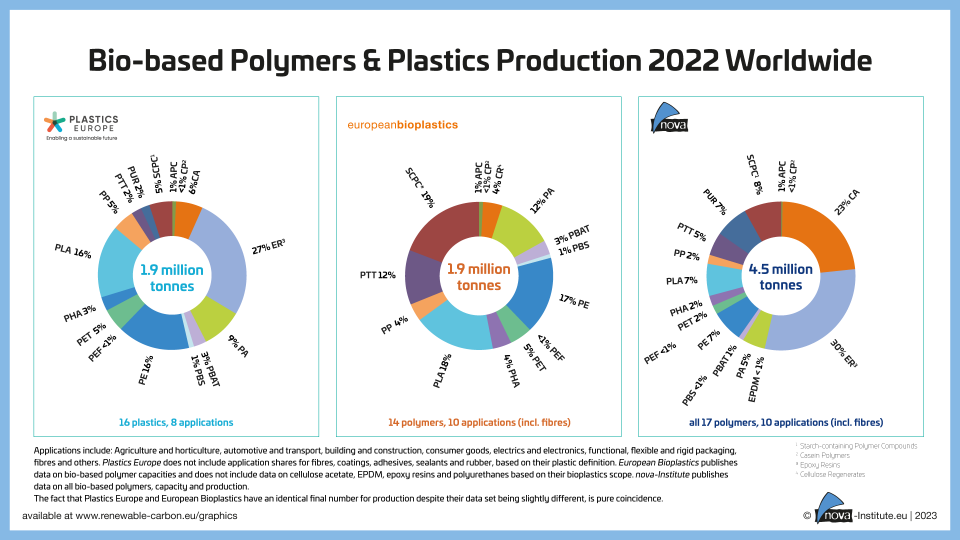
Bio-based Polymers & Plastics Production 2022 Worldwide (PNG)
Markets & Economy
1 Page
532 Downloads -
-
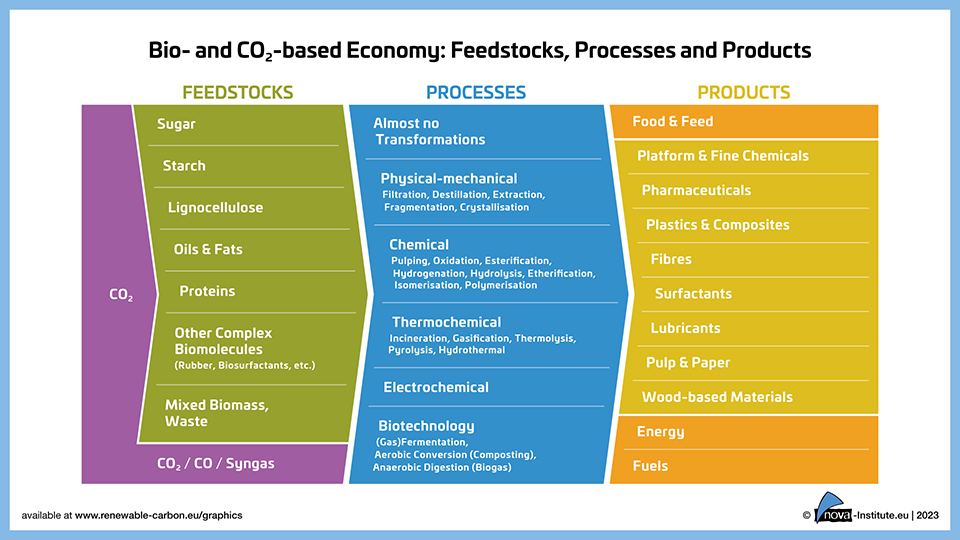
“Bio- and CO2-based Economy: feedstocks, processes and products” − Graphic – Update
Markets & Economy, Sustainability & Health, Technology
1 Page
3414 Downloads -
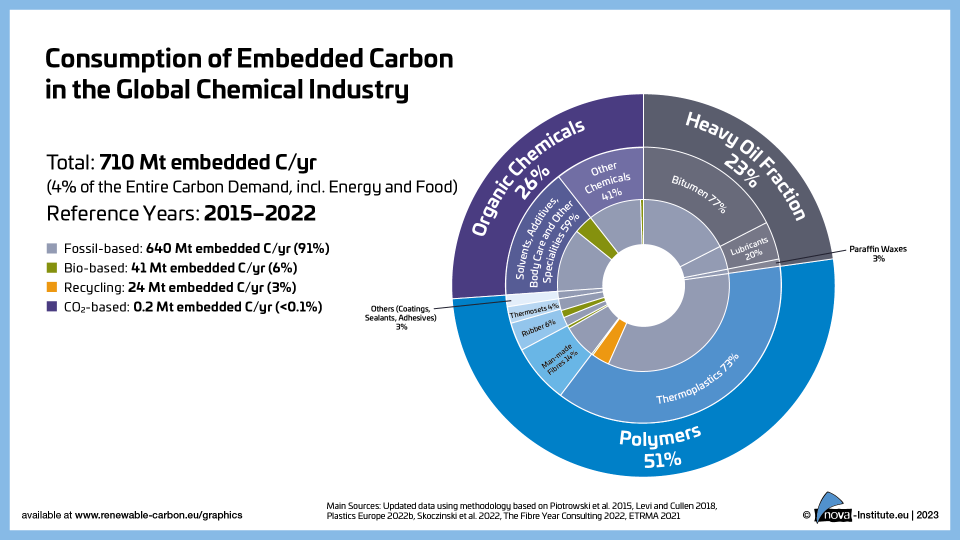
Consumption of Embedded Carbon in the Global Chemical Industry (PNG)
Markets & Economy, Policy
1 Page
141 Downloads -
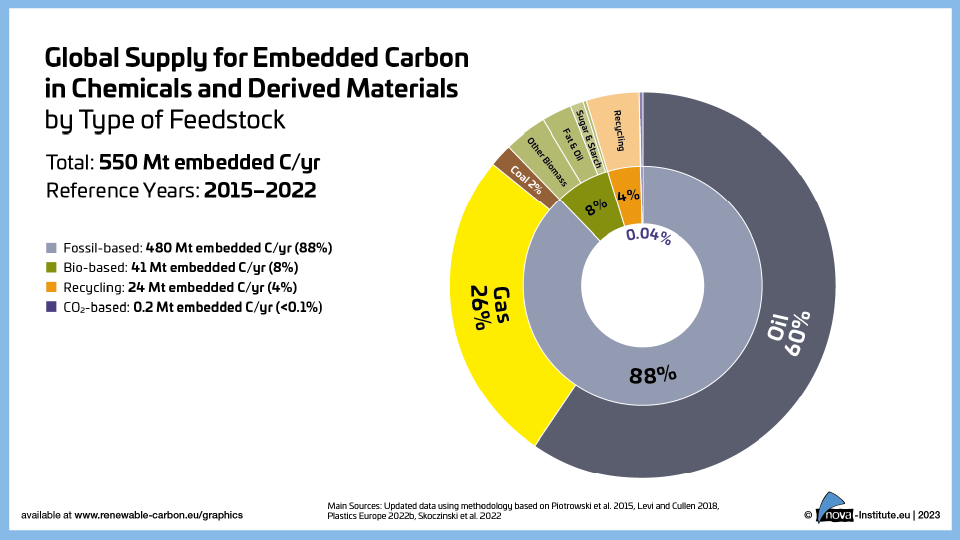
Global Supply for Embedded Carbon in Chemicals and Derived Materials by Type of Feedstock (PNG)
Markets & Economy, Policy
1 Page
184 Downloads -
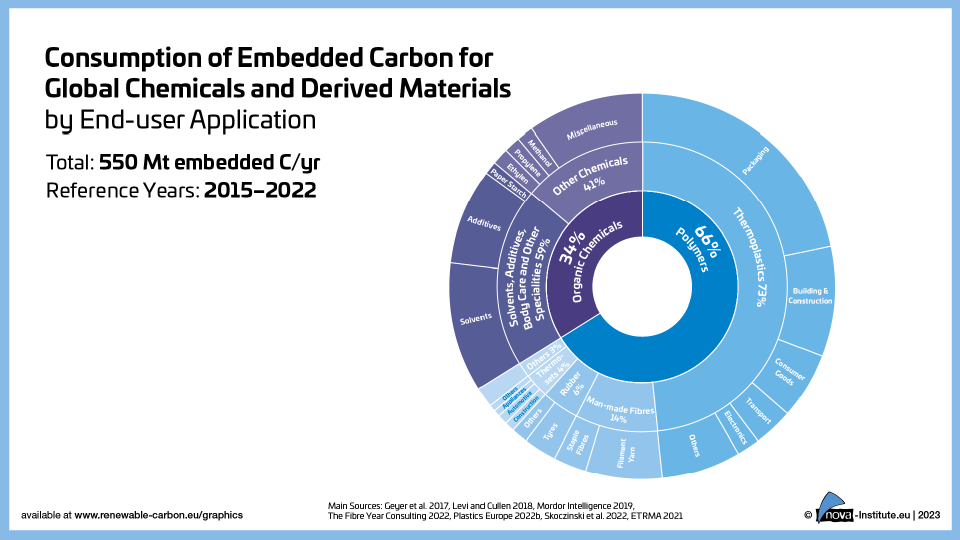
Consumption of Embedded Carbon for Global Chemicals and Derived Materials by End-user Application (PNG)
Markets & Economy, Policy
1 Page
125 Downloads -
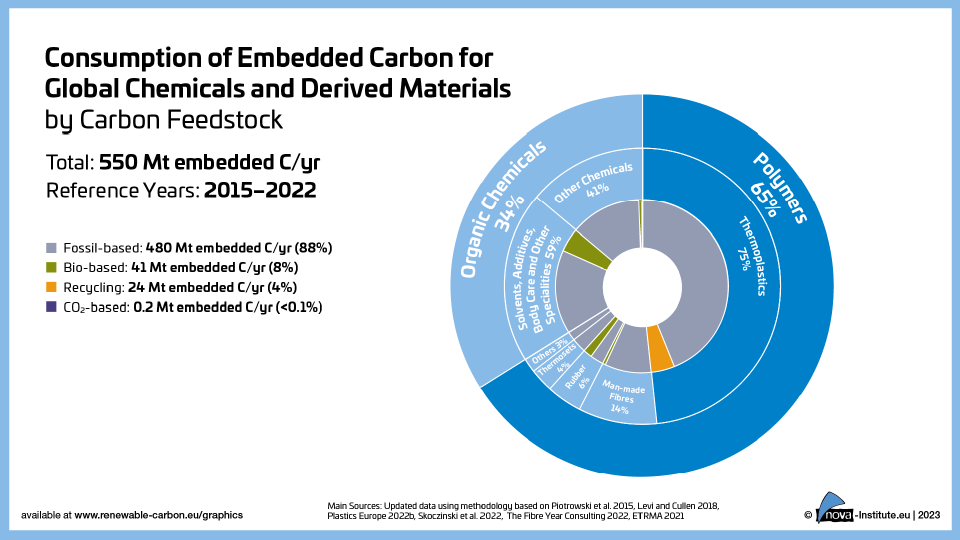
Consumption of Embedded Carbon for Global Chemicals and Derived Materials by Carbon Feedstock (PNG)
Markets & Economy, Policy
1 Page
120 Downloads -
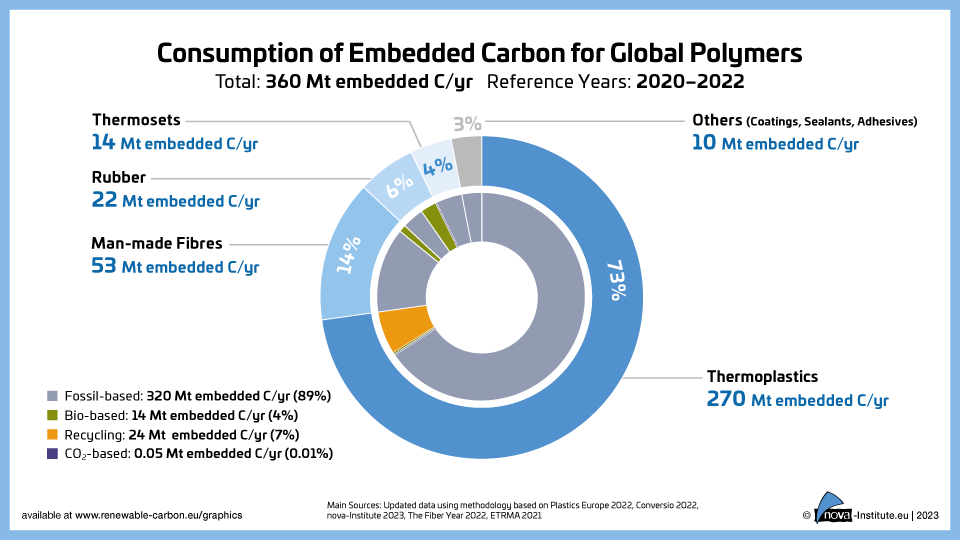
Consumption of Embedded Carbon for Global Polymers (PNG)
Markets & Economy, Policy
1 Page
135 Downloads