Showing 41–60 of 597
-
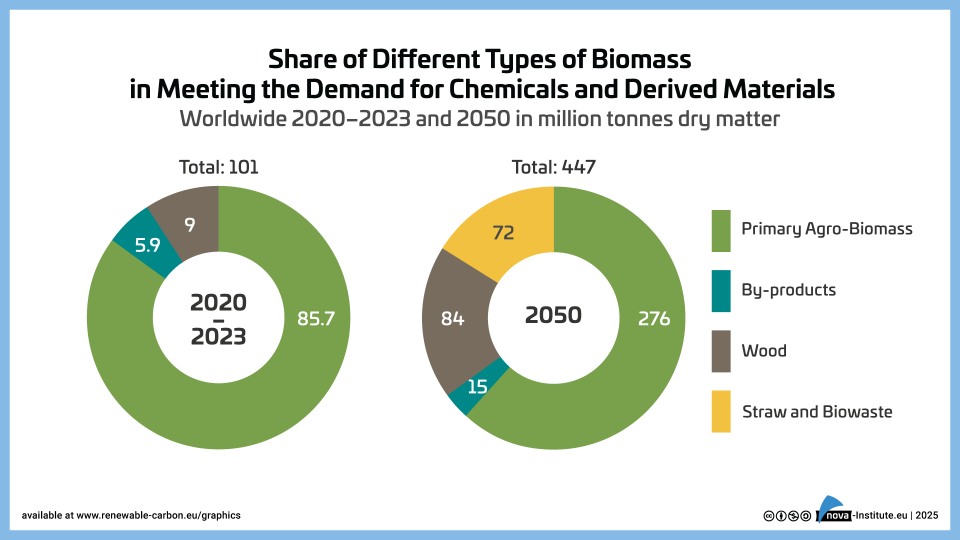
Share of Different Types of Biomass Worldwide 2023-2050 – Graphic (PNG)
Markets & Economy, Policy, Sustainability & Health
1 Page
41 Downloads
41 Downloads
2025-02
FREE
41
Downloads -
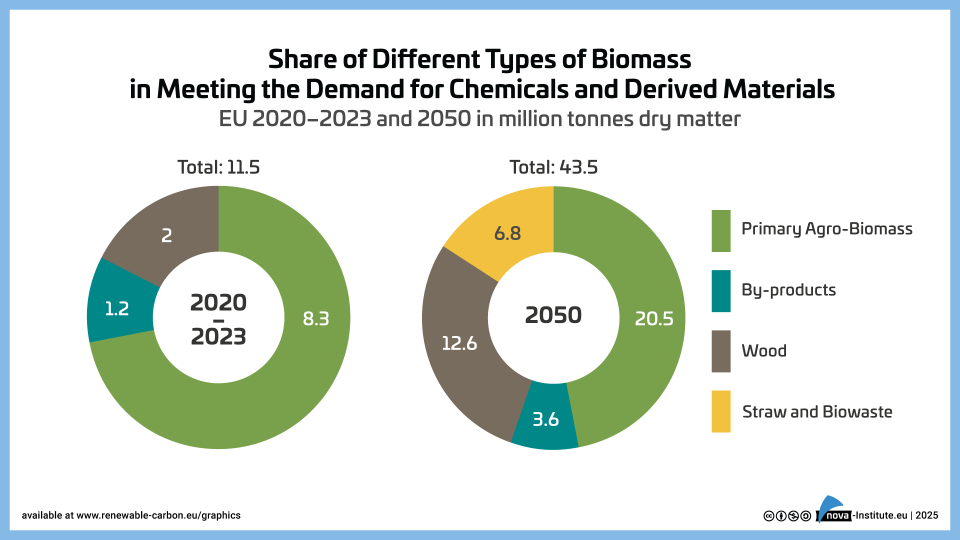
Share-of-Different-Types-of-Biomass-EU-2023–2050 – Graphic (PNG)
Markets & Economy, Policy, Sustainability & Health
1 Page
20 Downloads
20 Downloads
2025-02
FREE
20
Downloads -
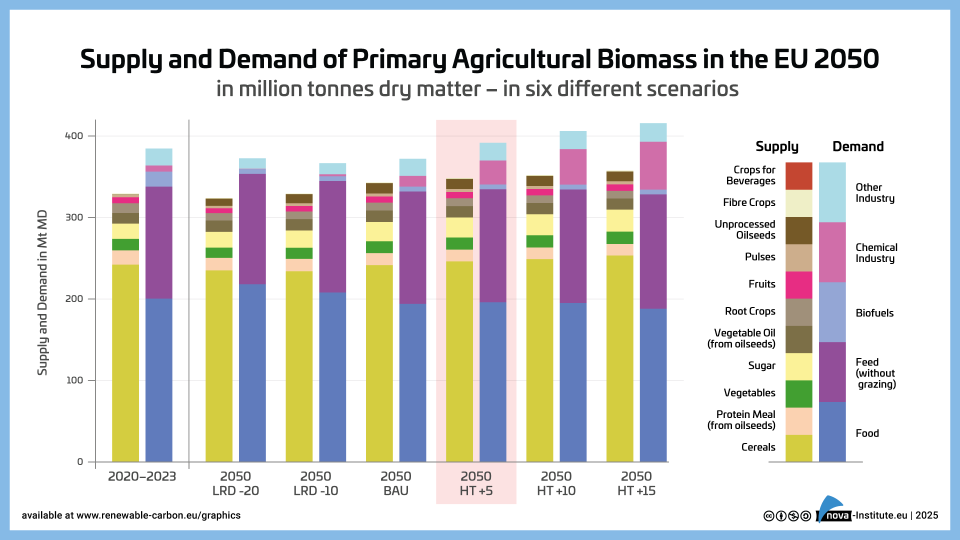
Supply and Demand of Agriculture Biomass in the EU 2050 – Graphic (PNG)
Markets & Economy, Policy, Sustainability & Health
1 Page
23 Downloads
23 Downloads
2025-02
FREE
23
Downloads -
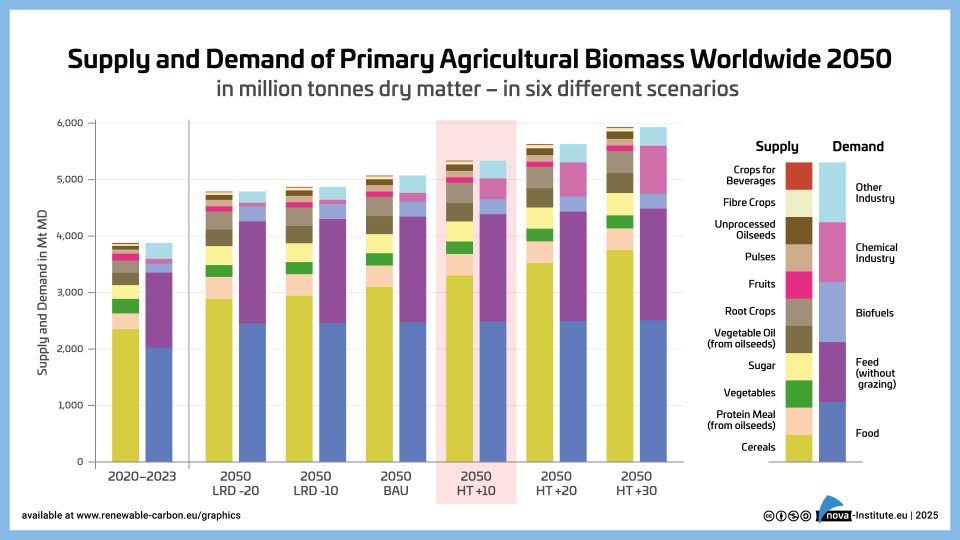
Supply and Demand of Agriculture Biomass Worldwide 2050 – Graphic (PNG)
Markets & Economy, Policy, Sustainability & Health
1 Page
21 Downloads
21 Downloads
2025-02
FREE
21
Downloads -
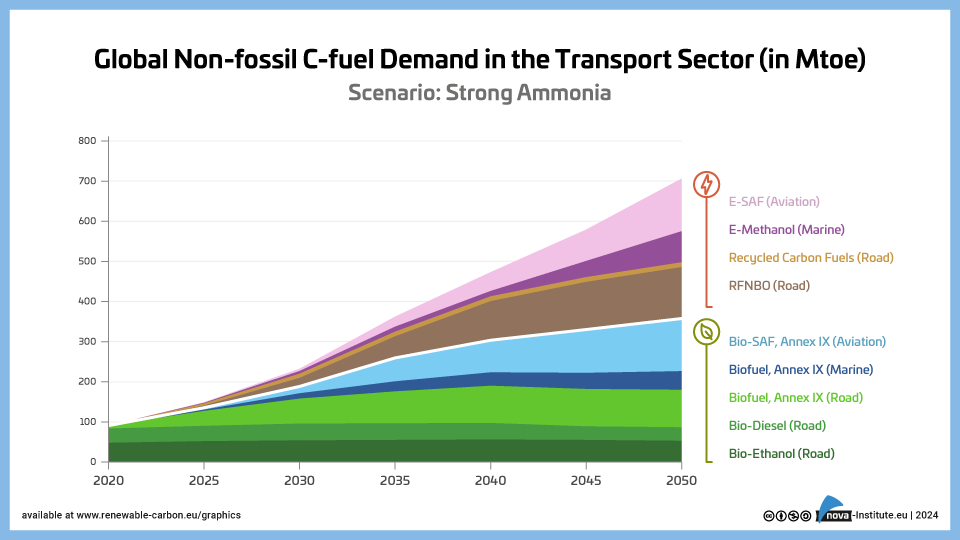
Global Non-fossil C-fuel Demand in the Transport Sector – Strong Ammonia – Graphic (PNG)
Markets & Economy, Policy, Sustainability & Health
1 Page
14 Downloads
14 Downloads
2025-01
FREE
14
Downloads -
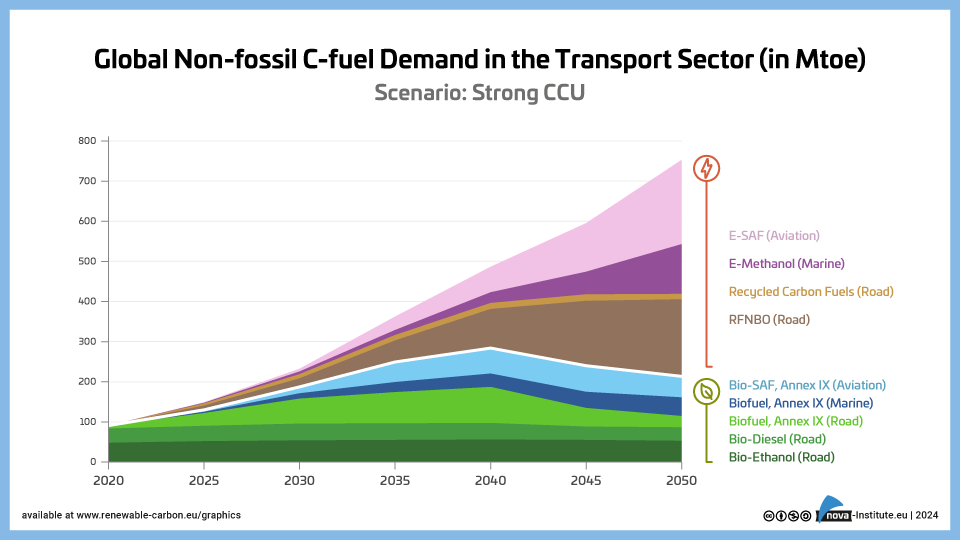
Global Non-fossil C-fuel Demand in the Transport Sector – Strong CCU – Graphic (PNG)
Markets & Economy, Policy, Sustainability & Health
1 Page
280 Downloads
280 Downloads
2025-01
FREE
280
Downloads -
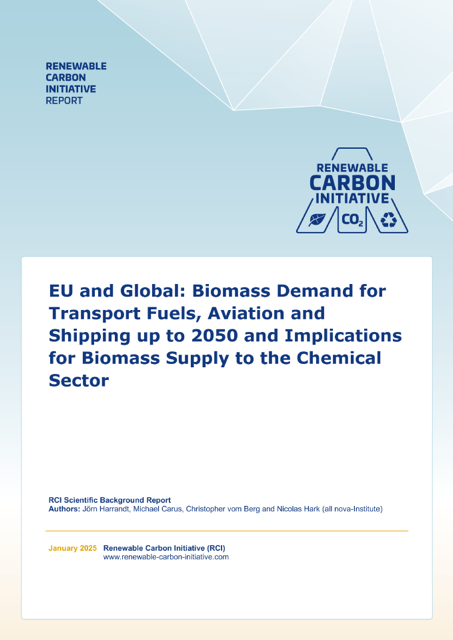
EU and Global: Biomass Demand for Transport Fuels, Aviation and Shipping up to 2050 and Implications for Biomass Supply to the Chemical Sector (PDF)
Markets & Economy, Policy, Sustainability & Health
44 Pages
973 Downloads
973 Downloads
2025-01
FREE
Free Shipping973
DownloadsThe Renewable Carbon Initiative’s Scientific Background Report explores three potential future scenarios for carbon-based fuel demand up to 2050 under current policy frameworks. It predicts a sharp rise in the demand for second-generation biomass biofuels, driven primarily by increasing quotas for aviation and shipping fuels. This growth raises concerns about ecological and resource sustainability and creates challenges for sectors like chemicals and materials, which rely on renewable carbon to reduce fossil dependency. Without similar regulatory incentives, these sectors may face limited access to critical feedstocks like biomass and captured carbon.
The report highlights that while bio-based and synthetic fuel production could indirectly benefit the chemical industry through by-products, competition with the fuel sector poses significant obstacles.The report includes 11 tables, 9 graphics, and a detailed overview of EU fuel regulations. Though focused on Europe, it also provides global insights, making it a valuable resource for stakeholders in biomass and CO2 utilisation sectors.
-
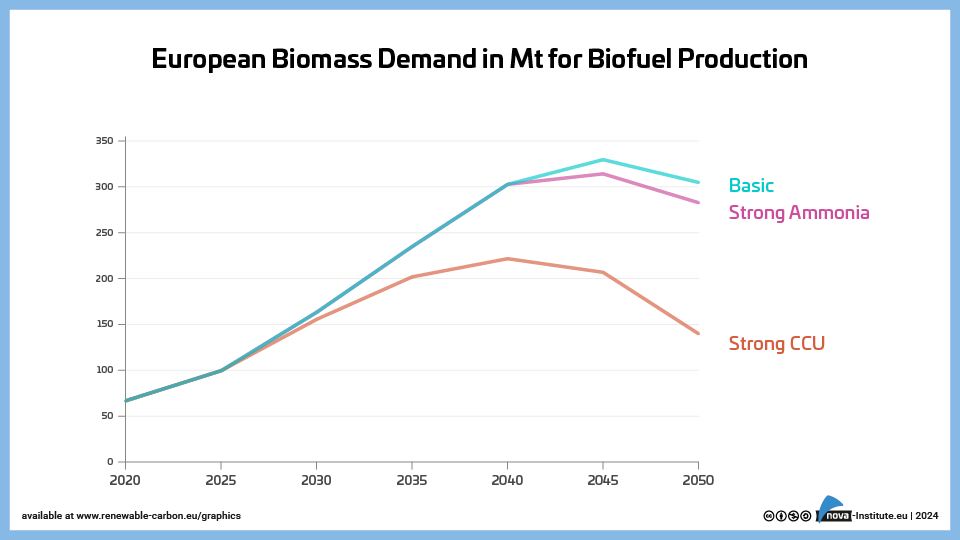
European Biomass Demand in Mt for Biofuel Production – Graphic (PNG)
Markets & Economy, Policy, Sustainability & Health
1 Page
30 Downloads
30 Downloads
2025-01
FREE
30
Downloads -
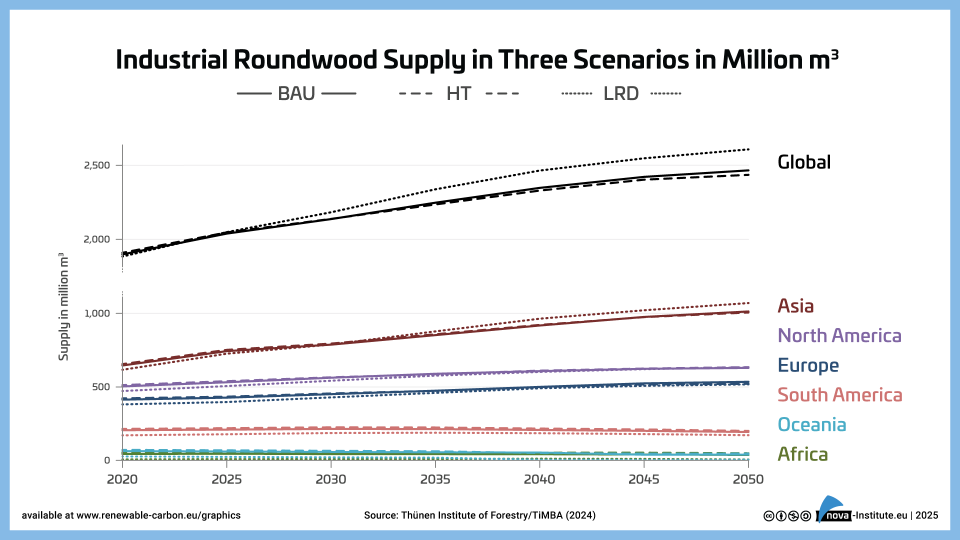
Industrial Roundwood Production in Three Scenarios in Million m3 – Graphic (PNG)
Markets & Economy, Policy, Sustainability & Health
1 Page
5 Downloads
5 Downloads
2025-01
FREE
5
Downloads -
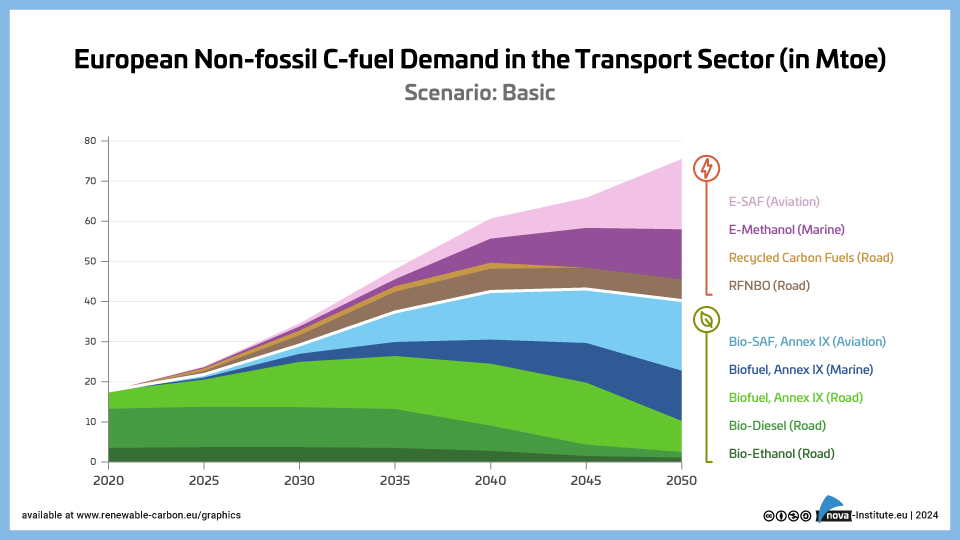
European Non-fossil C-fuel Demand in the Transport Sector – Basic – Graphic (PNG)
Markets & Economy, Policy, Sustainability & Health
1 Page
18 Downloads
18 Downloads
2025-01
FREE
18
Downloads -
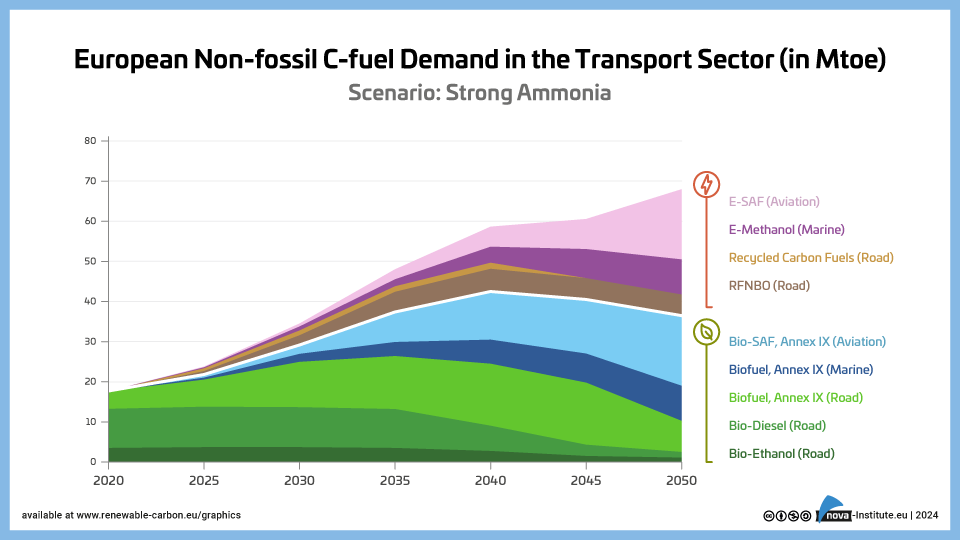
European Non-fossil C-fuel Demand in the Transport Sector – Strong Ammonia – Graphic (PNG)
Markets & Economy, Policy, Sustainability & Health
1 Page
7 Downloads
7 Downloads
2025-01
FREE
7
Downloads -
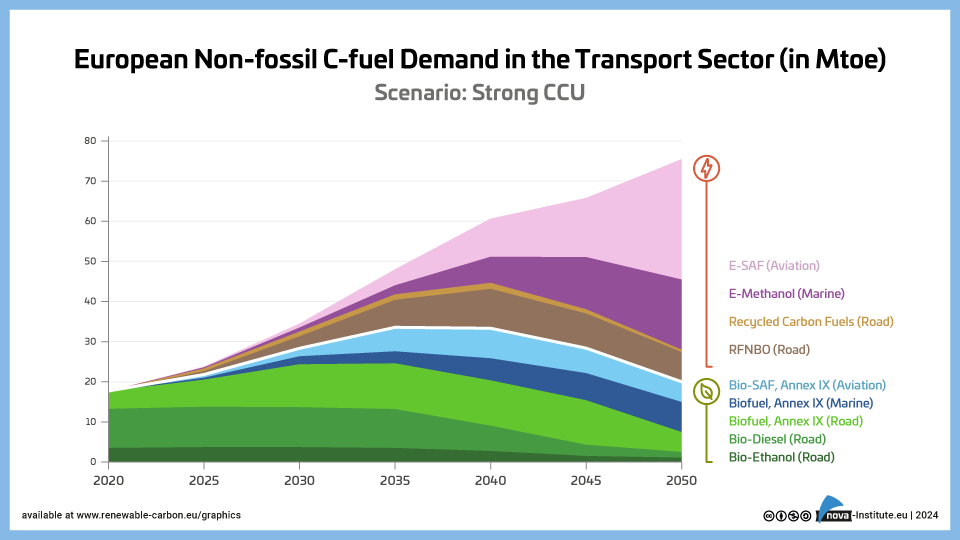
European Non-fossil C-fuel Demand in the Transport Sector – Strong CCU – Graphic (PNG)
Markets & Economy, Policy, Sustainability & Health
1 Page
13 Downloads
13 Downloads
2025-01
FREE
13
Downloads -
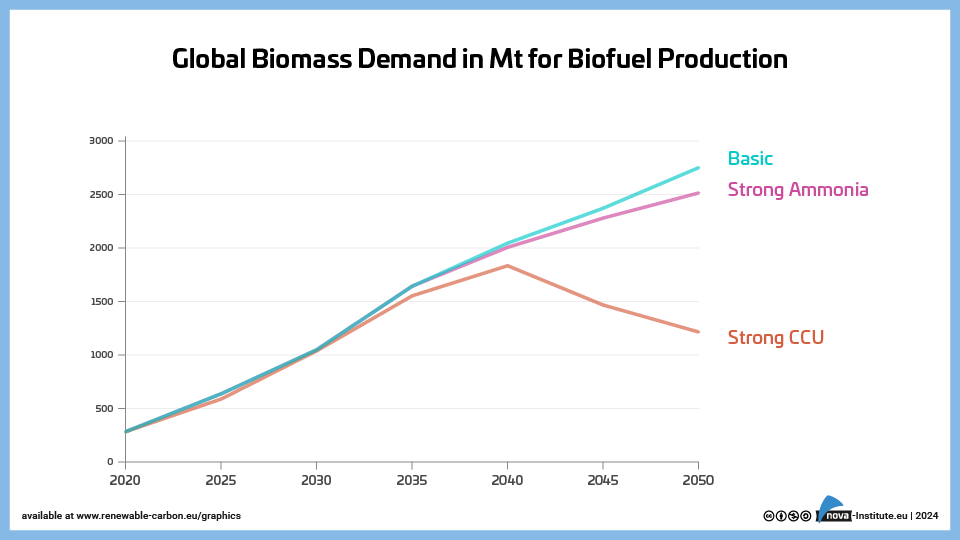
Global Biomass Demand in Mt for Biofuel Production – Graphic (PNG)
Markets & Economy, Policy, Sustainability & Health
1 Page
19 Downloads
19 Downloads
2025-01
FREE
19
Downloads -
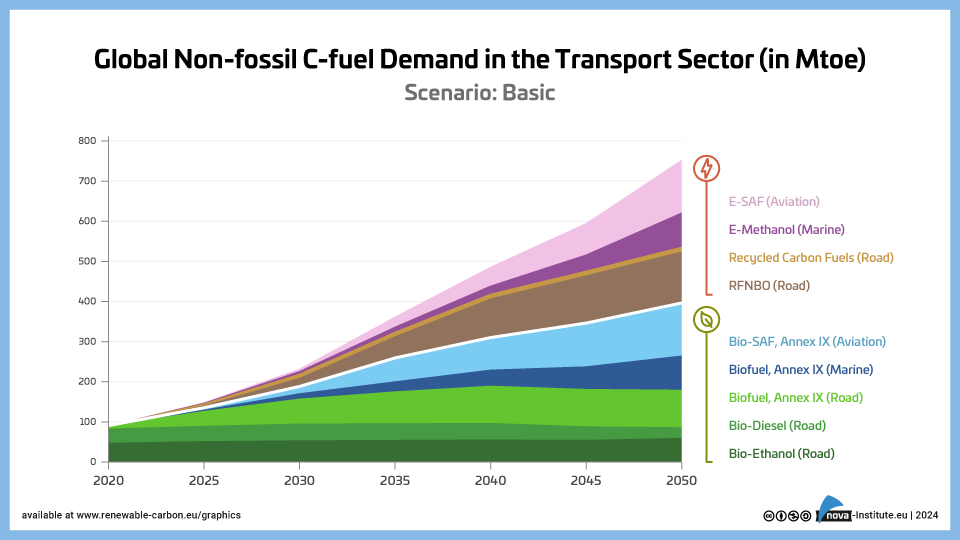
Global Non-fossil C-fuel Demand in the Transport Sector – Basic – Graphic (PNG)
Markets & Economy, Policy, Sustainability & Health
1 Page
19 Downloads
19 Downloads
2025-01
FREE
19
Downloads -
Advanced Recycling Conference 2024 (Proceedings)
Markets & Economy, Policy, Sustainability & Health, Technology

2024-12
150 € ex. tax
Plus 19% MwSt.Press
release Add to
cartThe proceedings of the Advanced Recycling Conference 2024 (20-21 November, https://advanced-recycling.eu) contain 42 conference presentations, the conference journal, sponsor documents and the press release.
-
Evaluation of Recent Reports on the Future of a Net-Zero Chemical Industry in 2050 (PDF)
Markets & Economy, Policy, Sustainability & Health
20 Pages
1412 Downloads
1412 Downloads
2024-11
FREE
Free Shipping1412
DownloadsThe Renewable Carbon Initiative’s Scientific Background Report assesses 24 scenarios from 15 studies to envision a net-zero chemical industry by 2050. The analysis anticipates continued growth in chemical production, projecting a 2.4-fold increase in global feedstock demand by 2050 compared to 2020 levels, with most expansion expected outside Europe while European feedstock volumes remain stable. To achieve net-zero emissions, the industry is projected to undergo a significant shift in feedstocks, with key renewable carbon sources identified as biomass (22%), carbon capture and utilisation (33%), and recycling (20%), while the remaining 24% comes from fossil sources with carbon capture and storage. For plastics specifically, recycling is expected to play an even larger role, accounting for 42% of feedstocks on average. This transition will require continued innovation and investment in renewable carbon technologies to meet ambitious defossilisation goals.
The report provides invaluable insights for industry leaders, policymakers, and researchers, highlighting the urgent need for action to achieve a net-zero future in the chemical sector by 2050.
DOI No.: https://doi.org/10.52548/SXWV6083
-
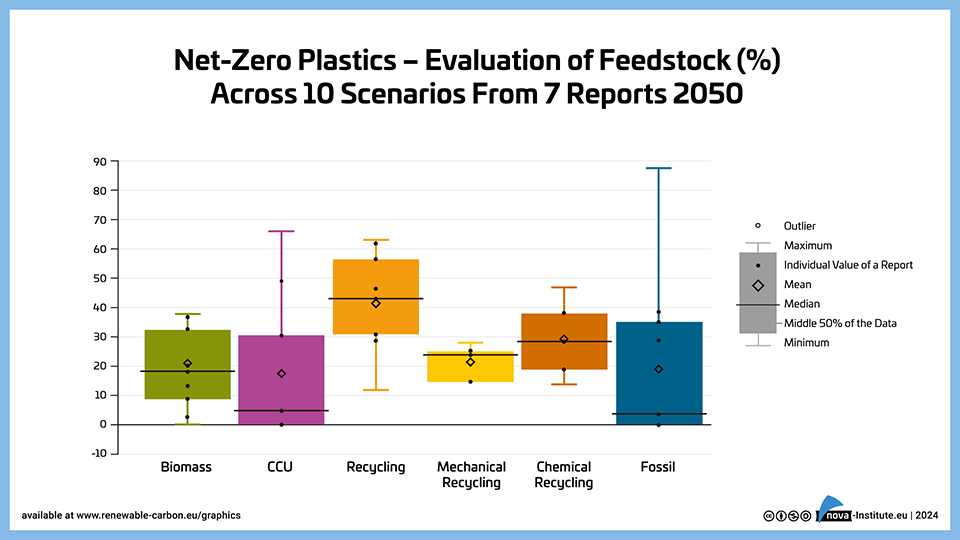
Net-Zero Plastics – Evaluation of Feedstock (%) Across 10 Scenarios from 7 Reports 2050 – Graphic (PNG)
Markets & Economy, Policy, Sustainability & Health
1 Page
95 Downloads
95 Downloads
2024-11
FREE
95
DownloadsThe graph illustrates feedstock projections specifically for the plastics sector by 2050, analysing 10 scenarios from 7 reports, where recycling emerges as the dominant feedstock at 42% (combining mechanical and chemical recycling), while biomass (21%), CCU (17%), and fossil with CCS (19%) play supporting roles. The data shows less variation in projections compared to the chemical industry overall, suggesting stronger agreement on the future role of recycling in plastics production.
-
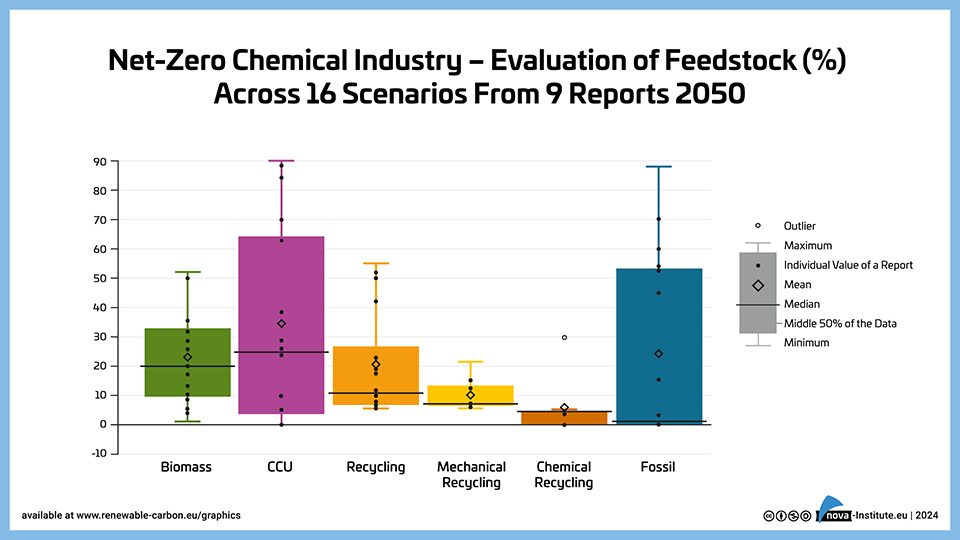
Net-Zero Chemical Industry – Evaluation of Feedstock (%) Across 16 Scenarios from 9 Reports 2050 – Graphic (PNG)
Markets & Economy, Policy, Sustainability & Health
1 Page
74 Downloads
74 Downloads
2024-11
FREE
74
DownloadsThe graph shows the distribution of feedstock sources for the net-zero chemical industry by 2050, based on 16 scenarios from 9 reports, with CCU having the highest mean share at 33%, followed by biomass (22%), recycling (20%, split between mechanical and chemical), and fossil with CCS (24%). The data reveals significant variability across scenarios, particularly for CCU which ranges from near 0% to 90%, while both biomass and recycling show more moderate ranges, indicating a general consensus on their roles in the future chemical industry.
-
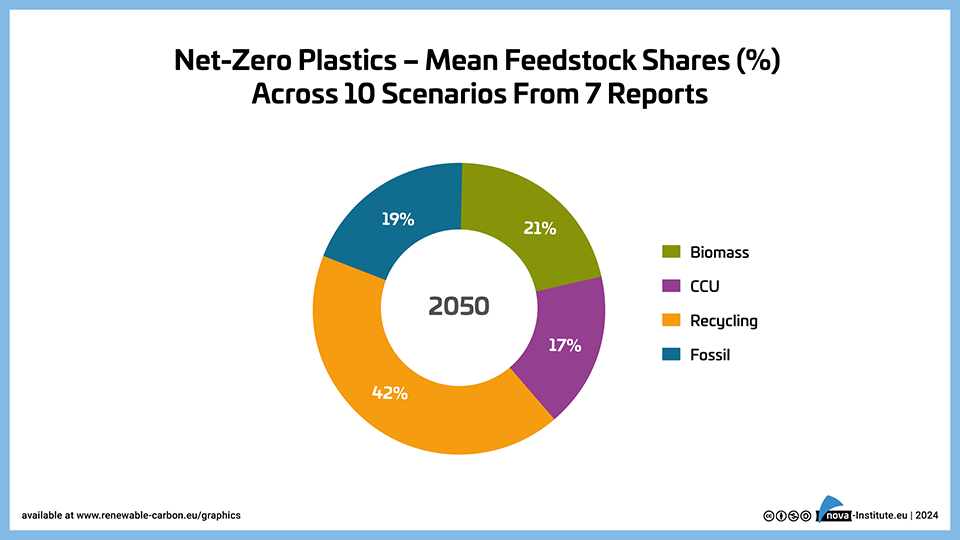
Net-Zero Plastics – Mean Feedstock Shares (%) Across 10 Scenarios From 7 Reports – Graphic (PNG)
Markets & Economy, Policy, Sustainability & Health
1 Page
61 Downloads
61 Downloads
2024-11
FREE
61
DownloadsThe graph presents the mean feedstock shares for the 2050 net-zero plastics sector, derived from 10 scenarios across 7 reports. In this projection, recycling dominates with a 42% share, followed by biomass (21%), fossil & CCS (19%), and CCU (17%), highlighting the increased potential for circularity in the plastics industry compared to the broader chemical sector.
-
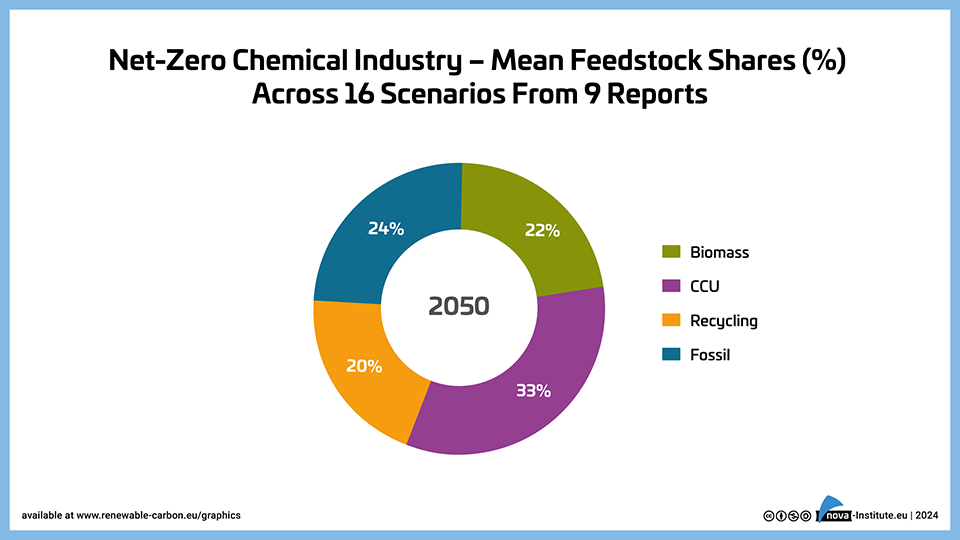
Net-Zero Chemical Industry – Mean Feedstock Shares (%) Across 16 Scenarios From 9 Reports – Graphic (PNG)
Markets & Economy, Policy, Sustainability & Health
1 Page
47 Downloads
47 Downloads
2024-11
FREE
47
DownloadsThe graph illustrates the mean feedstock shares projected for the 2050 net-zero chemical industry, based on 16 scenarios across 9 reports. The chart shows a diverse mix of feedstocks, with CCU (33%) and recycling (20%) playing significant roles alongside biomass (22%), while fossil & CCS still account for 24% of the feedstock share.


