Showing 41–60 of 380
-
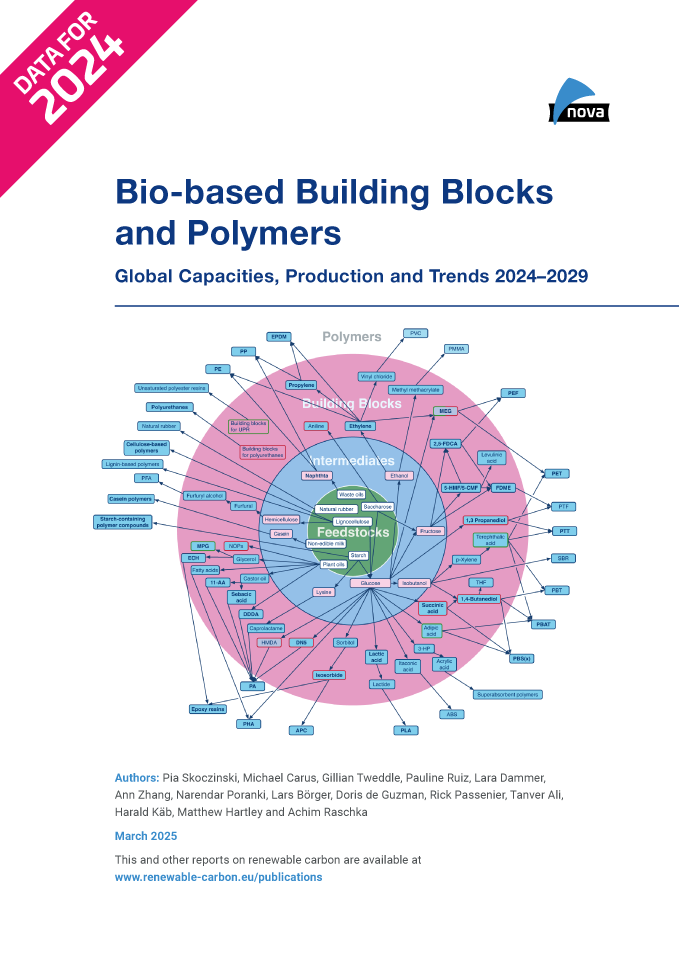
Bio-based Building Blocks and Polymers – Global Capacities, Production and Trends 2024–2029 (PDF)
NewMarkets & Economy
434 Pages

-
Evaluating LCA Approaches and Methodologies for Renewable Carbon Sources Report 1 of 3: Renewable Carbon in LCA Guidelines – RCI Report (March 2025)
Markets & Economy, Policy, Sustainability & Health
145 Pages
1218 Downloads -
Evaluating LCA Approaches and Methodologies for Renewable Carbon Sources Report 2 of 3: Renewable Carbon in Recycling Situations – RCI Report (March 2025)
Markets & Economy, Policy, Sustainability & Health
37 Pages
882 Downloads -
Evaluating LCA Approaches and Methodologies for Renewable Carbon Sources Report 3 of 3: Non-technical Summary – RCI Report (March 2025)
Markets & Economy, Policy, Sustainability & Health
15 Pages
1061 Downloads -
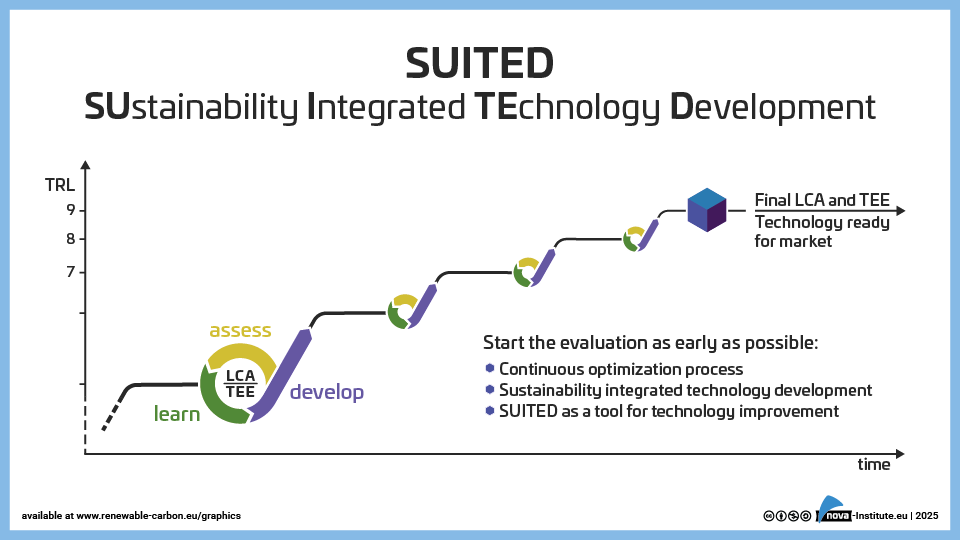
SUITED approach: SUstainable Integrated TEchnology Development (PNG)
Markets & Economy, Sustainability & Health
1 Page
27 Downloads -
Bio-based Polymers Worldwide (PDF)
Markets & Economy, Policy, Sustainability & Health
5 Pages
881 Downloads -
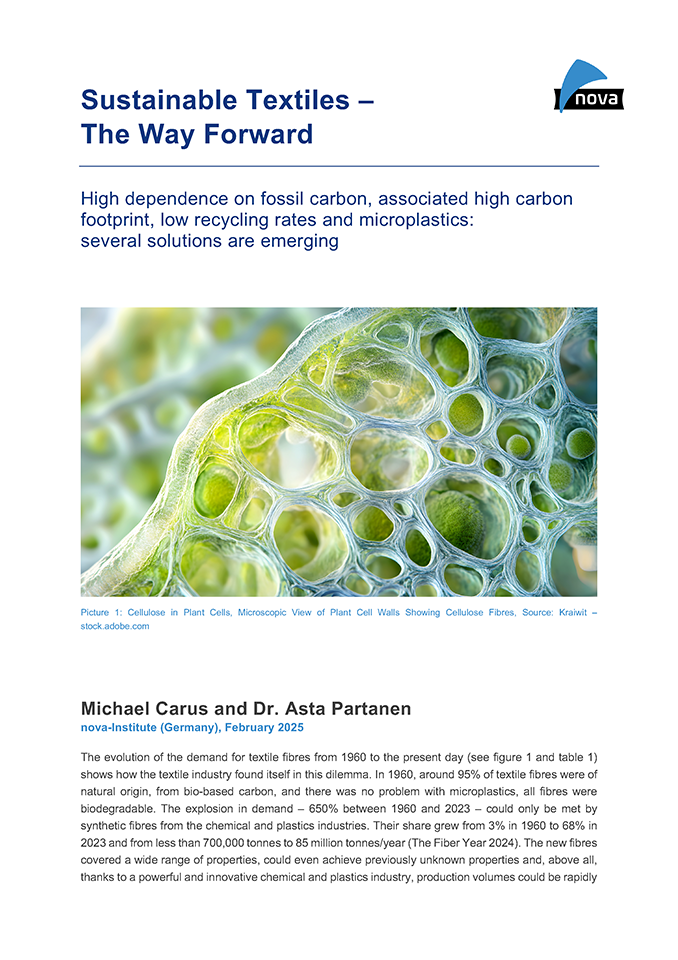
Sustainable textiles – the way forward (PDF)
Markets & Economy, Sustainability & Health
6 Pages
617 Downloads -
Global Major Fibre Types by Production in % (PNG)
Markets & Economy, Sustainability & Health
1 Page
48 Downloads -
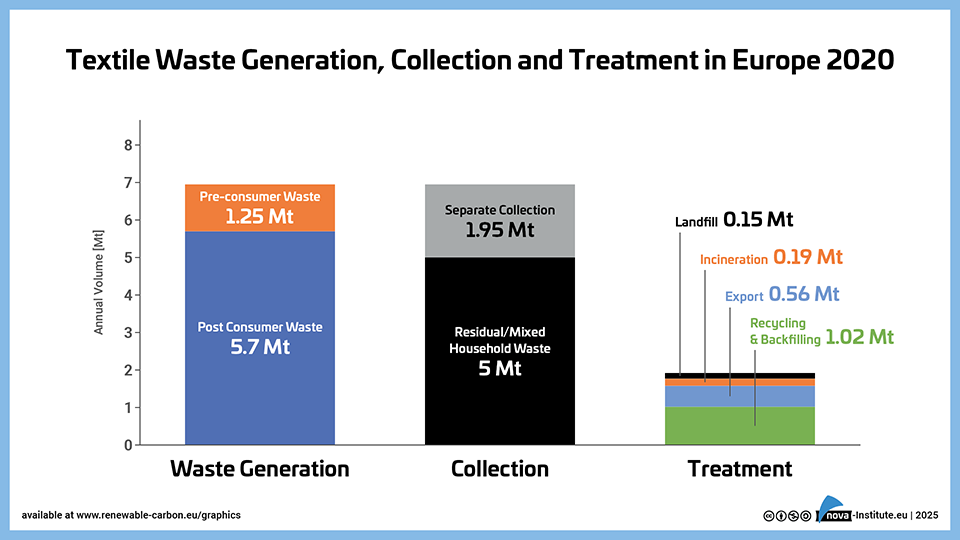
Textile-Waste-Generation-Collection-and-Treatment-in-Europe-2020 (PNG)
Markets & Economy, Sustainability & Health
1 Page
53 Downloads -
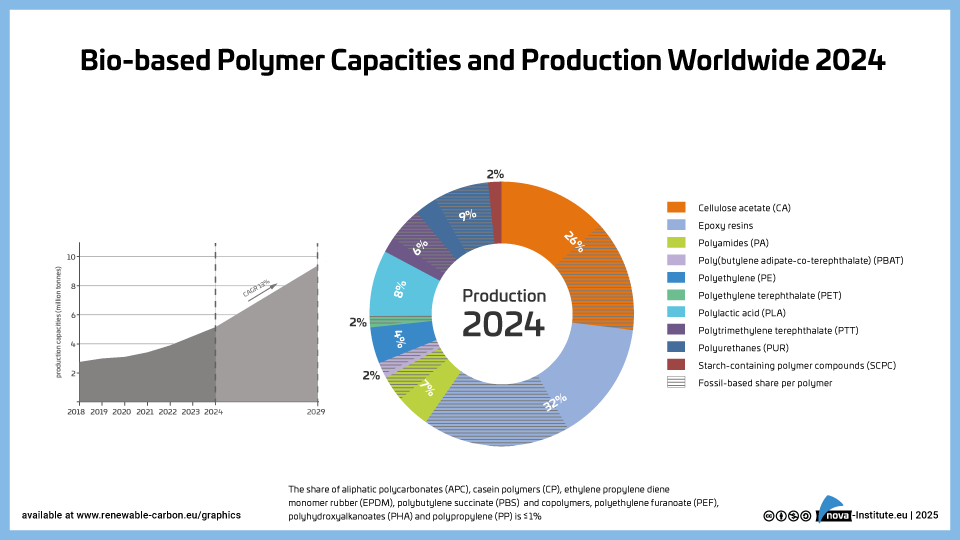
Bio-based-Polymer-Production-and-Bio-based-shares-2024 (PNG)
Markets & Economy, Policy, Sustainability & Health
1 Page
189 Downloads -
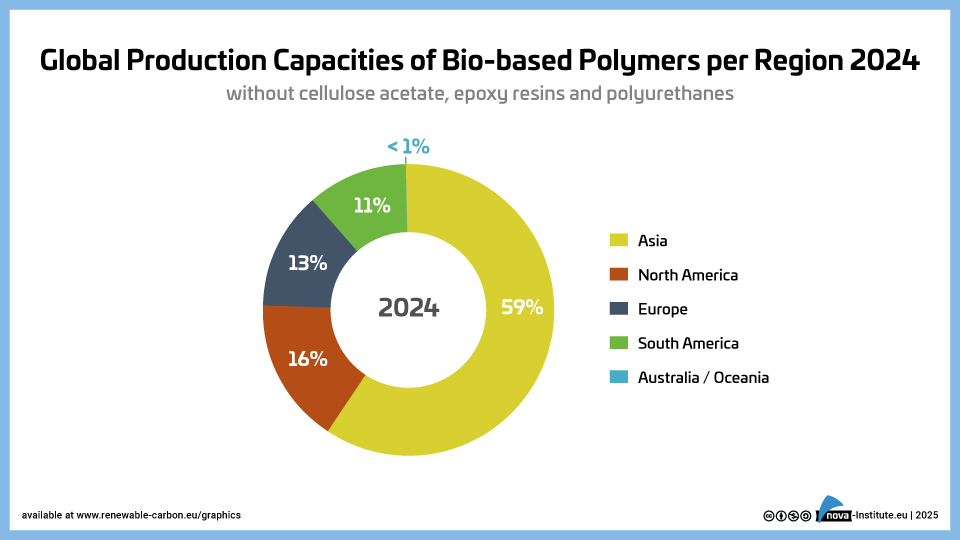
Global-Production-Capacities-of-Bio-based-Polymers-per-Region-2024 (PNG)
Markets & Economy, Policy, Sustainability & Health
1 Page
48 Downloads -
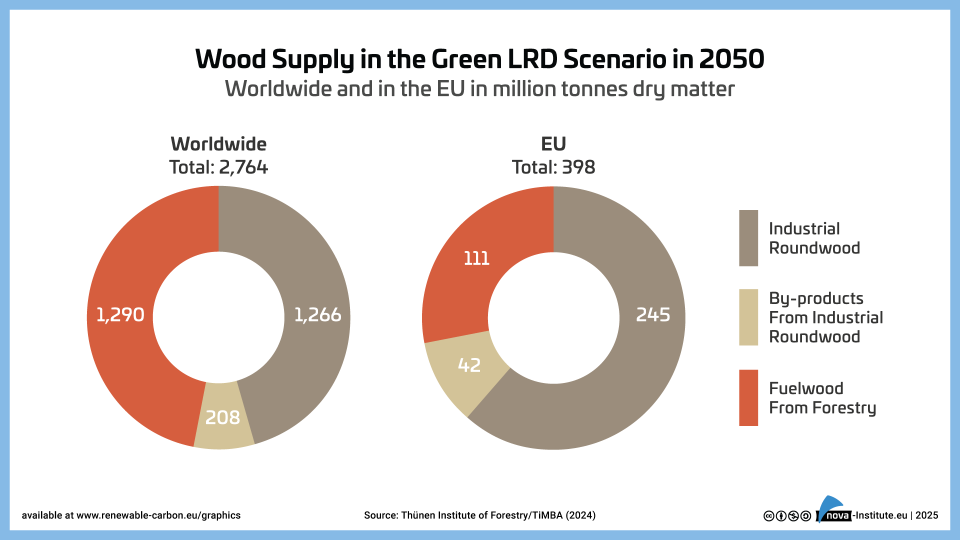
Wood Supply in the Green LRD Scenario in 2050 – Graphic (PNG)
Markets & Economy, Policy, Sustainability & Health
1 Page
15 Downloads -
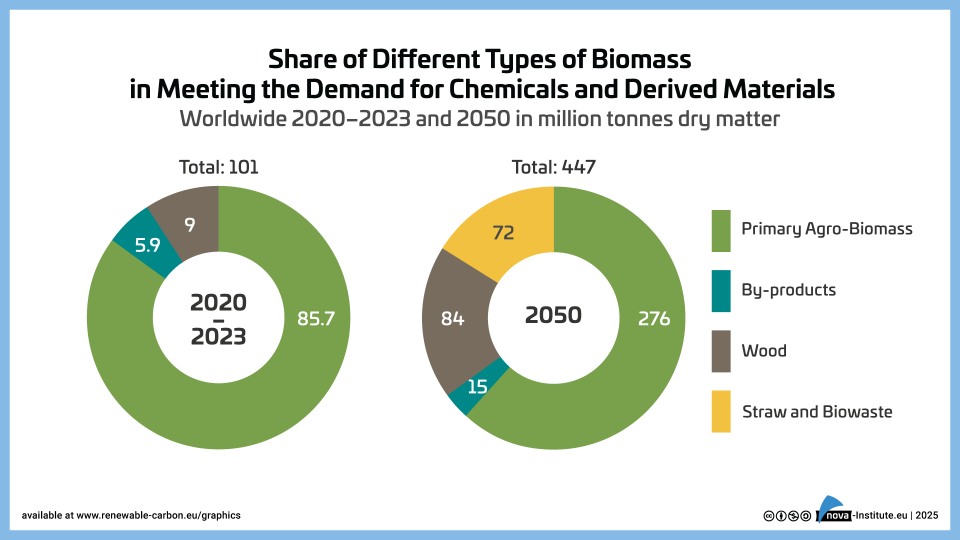
Share of Different Types of Biomass Worldwide 2023-2050 – Graphic (PNG)
Markets & Economy, Policy, Sustainability & Health
1 Page
70 Downloads -
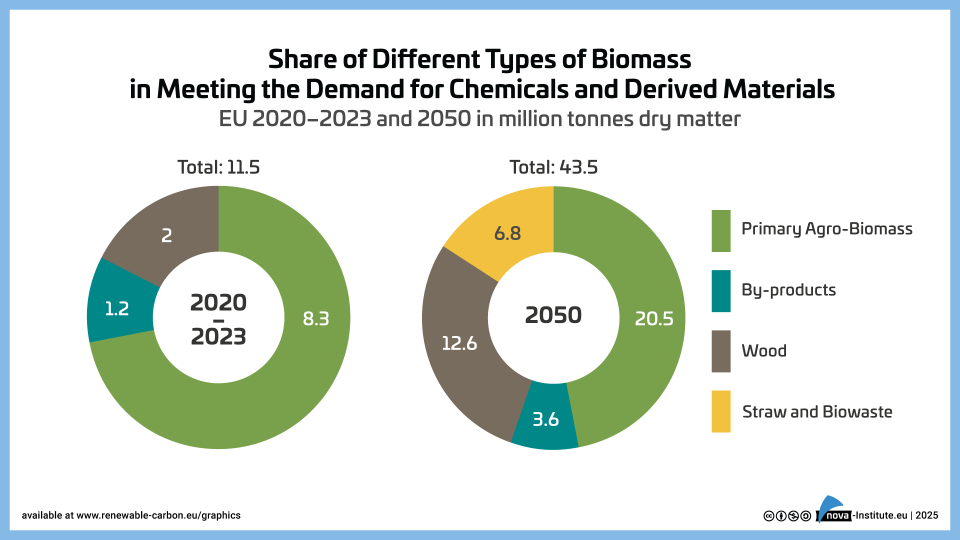
Share-of-Different-Types-of-Biomass-EU-2023–2050 – Graphic (PNG)
Markets & Economy, Policy, Sustainability & Health
1 Page
37 Downloads -
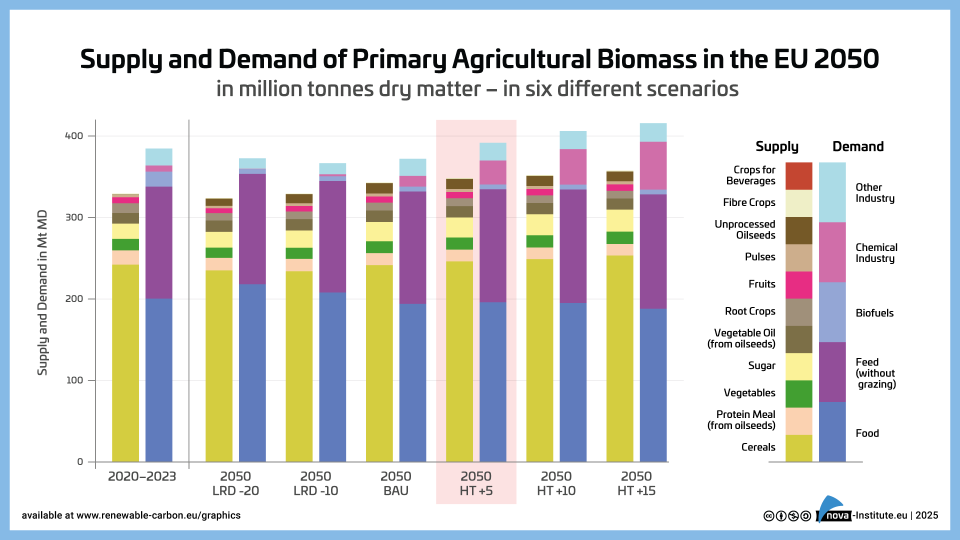
Supply and Demand of Agriculture Biomass in the EU 2050 – Graphic (PNG)
Markets & Economy, Policy, Sustainability & Health
1 Page
41 Downloads -
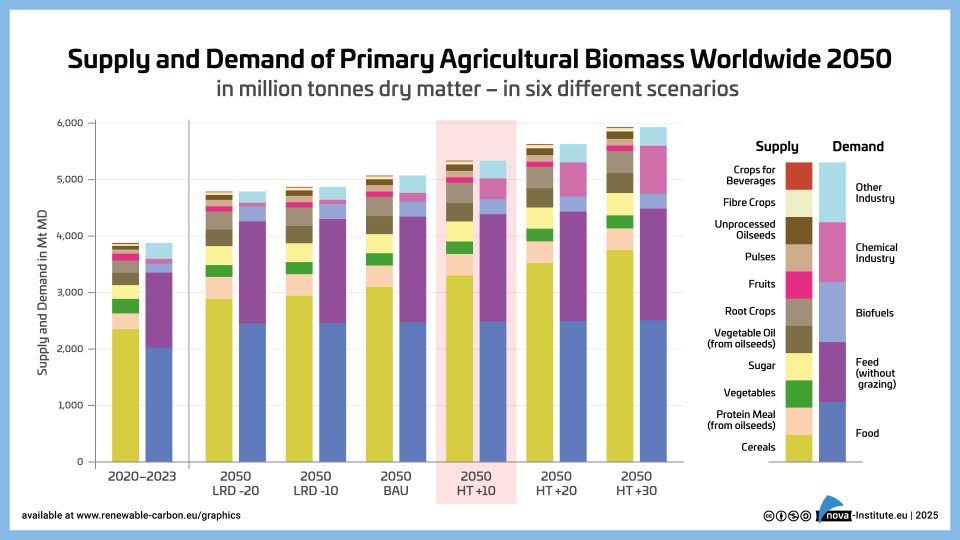
Supply and Demand of Agriculture Biomass Worldwide 2050 – Graphic (PNG)
Markets & Economy, Policy, Sustainability & Health
1 Page
48 Downloads -
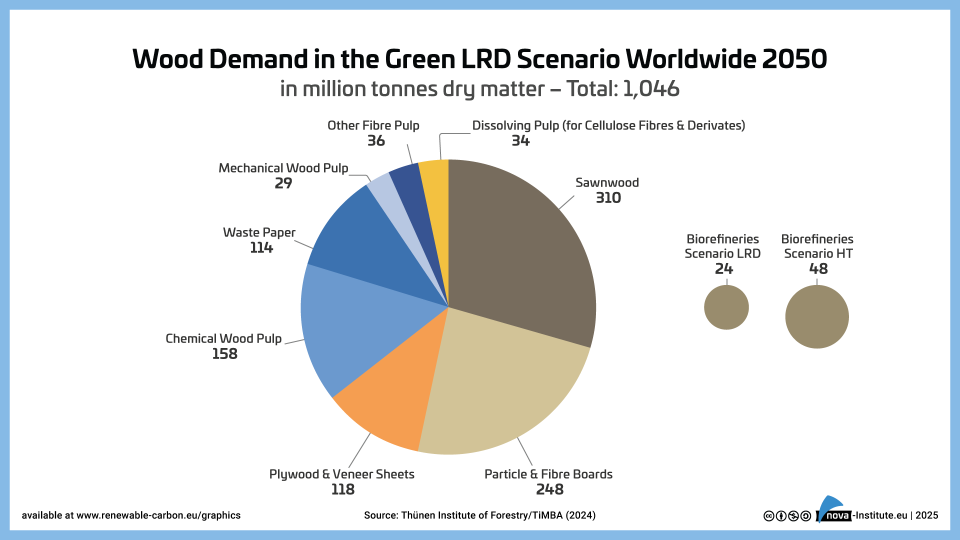
Wood Demand in the Green LRD Scenario Worldwide 2050 – Graphic (PNG)
Markets & Economy, Policy, Sustainability & Health
1 Page
17 Downloads -
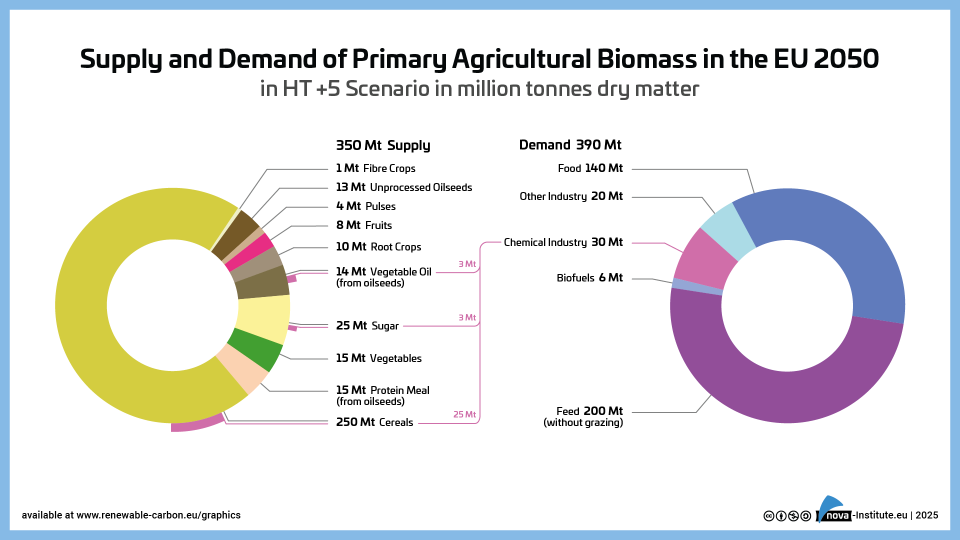
Supply and Demand of Agricultural Biomass in the EU 2050 in HT +5 Scenario – Graphic (PNG)
Markets & Economy, Policy, Sustainability & Health
1 Page
32 Downloads -
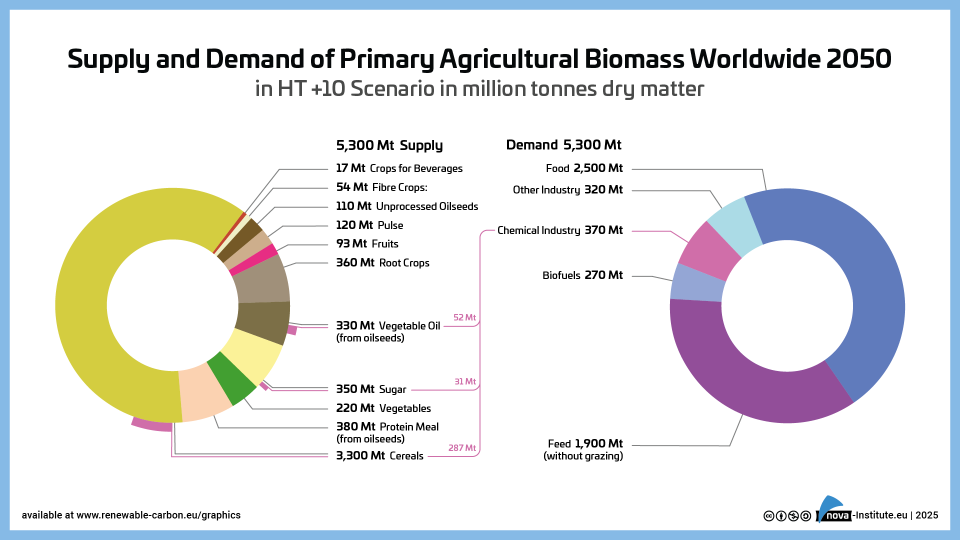
Supply and Demand of Agricultural Biomass Worldwide 2050 in HT +10 Scenario – Graphic (PNG)
Markets & Economy, Policy, Sustainability & Health
1 Page
47 Downloads -
Is there Enough Biomass to Defossilise the Chemicals and Derived Materials Sector by 2050? – A Joint BIC and RCI Scientific Background Report (PDF)
Markets & Economy, Policy, Sustainability & Health
41 Pages
2021 Downloads