Textiles are on average the fourth-highest source of pressure on the environment and climate change from a European consumption perspective, as shown in previous EEA briefings. Europe faces major challenges managing used textiles, including textiles waste. As reuse and recycling capacities in Europe are limited, a large share of used textiles collected in the EU is traded and exported to Africa and Asia, and their fate is highly uncertain. The common public perception of used clothing donations as generous gifts to people in need does not fully match reality.
Key messages
- The amounts of used textiles exported from the EU has tripled over the last two decades from slightly over 550,000 tonnes in 2000 to almost 1.7 million tonnes in 2019.
- The amounts of used textiles exported in 2019 was on average 3.8 kilograms per person, or 25% of the approximately 15 kg of textiles consumed each year in the EU.
- The fate of used textiles exported from the EU is highly uncertain. The perception of used clothing donations as generous gifts to people in need does not fully match reality. Used clothing is increasingly part of a specialised and traded global commodity value chain.
- In 2019, 46% of used textiles ended up in Africa. Imported, used textiles on this continent primarily go towards local reuse as there is a demand for cheap, used clothes from Europe. What is not fit for reuse mostly ends up in open landfills and informal waste streams.
- In 2019, 41% of used textiles ended up in Asia. Most used textiles on this continent are imported to dedicated economic zones where they are sorted and processed. The used textiles are mostly downcycled into industrial rags or filling, or re-exported for recycling in other Asian countries or for reuse in Africa. Textiles that cannot be recycled or re-exported are likely to end up in landfills.
- Due to the obligation to collect textile waste as a separate fraction in all EU countries by 2025, the amounts of used textiles collected may increase further. The EU strategy for sustainable and circular textiles identifies ways to address the challenges arising from exporting used textiles, including textile waste.
In this briefing, we look at the patterns and trends in EU used textile exports from 2000 to 2019, based on data from the United Nations (Comtrade) (UN Comtrade, 2022a). We show how exports have increased year by year and shifted from mainly going to Africa to being almost equally exported to Africa and Asia. We touch on the challenges around what happens to used textiles in the importing countries. Furthermore, we show how some challenges related to these exports are being addressed in current and proposed EU policies.
There are limitations to the data. Trade data are based on individual countries’ reporting and therefore come with some levels of uncertainty. This has been taken into account in the analysis, and all numbers should be understood as indicative. More information on the results presented in this briefing can be found in the underpinning report from the EEA’s European Topic Centre on Circular Economy and Resource Use.
EU exports of used textiles: patterns and trends
Between 2000 and 2019, the amount of used textiles exported from the EU increased from a little over 550,000 tonnes to almost 1.7 million tonnes. The latter is equal to 3.8 kg per person (Figure 1), which is about 25% of the 14.8 kg of clothing, footwear and household textiles consumed per person in 2020 (EEA, 2022).
Figure 1. Exports of used textiles from the EU (EU-27 and the UK) to the rest of the world, 2000-2019, by weight (million tonnes)
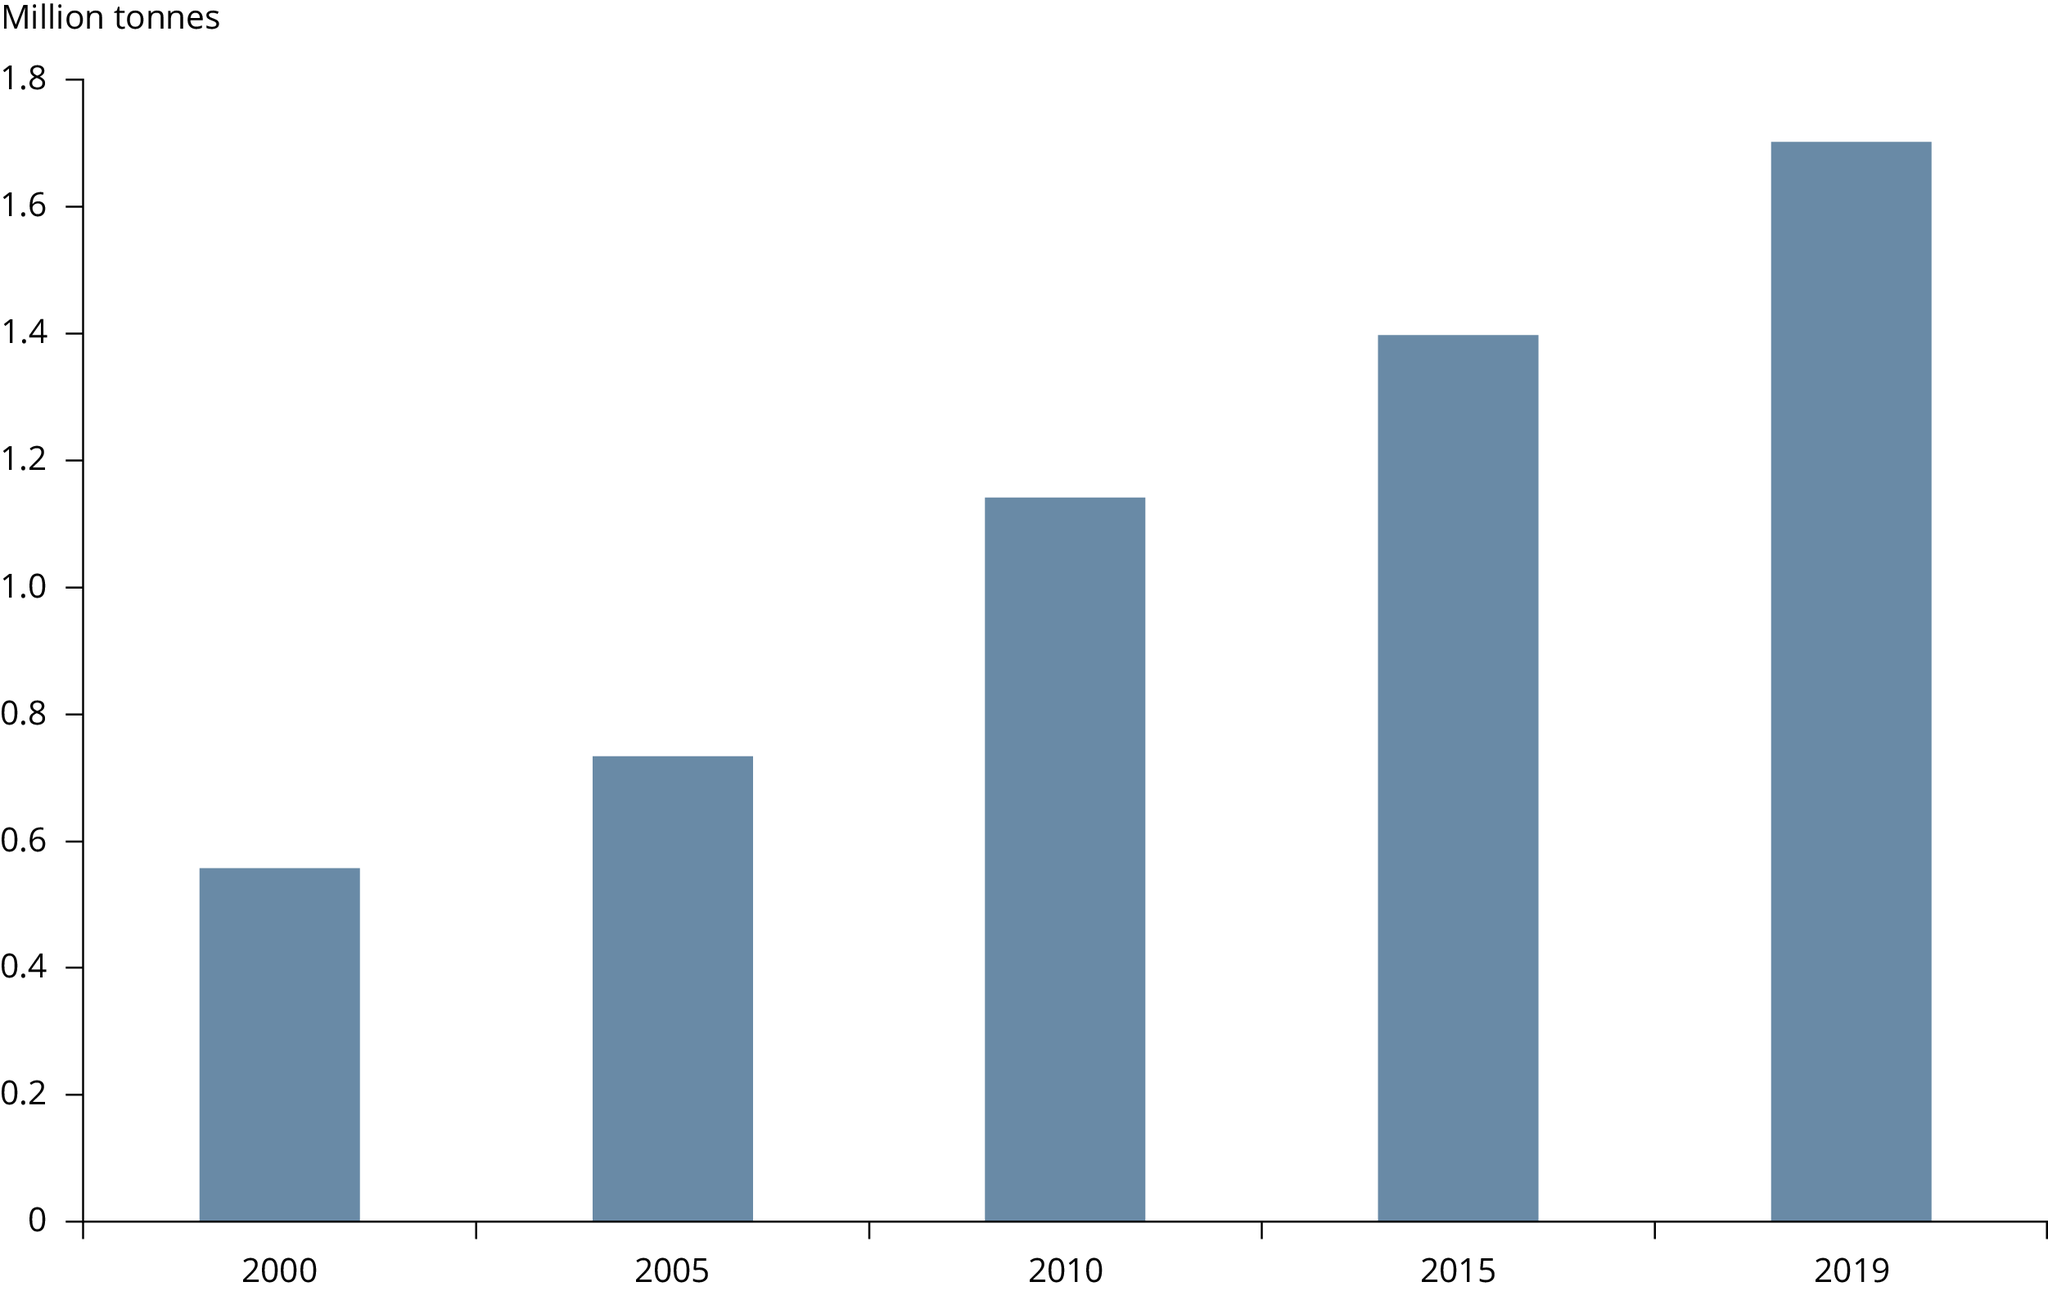
Source: (UN Comtrade, 2022d)
Explore different chart formats and data here
Over the last 20 years, the trade value of used textiles has lagged behind the increase in net weight, showing that importers are currently paying less per kilogram than some years ago. In 2019, the average price paid per kilogram had dropped to about EUR 0.57. These are in constant prices, so the drop in price is even higher considering inflation and general price increases over the period. Trade value might also have decreased due to a decrease in quality or the market becoming saturated, as suggested by the recent report from Fashion for Good (2022).
Box 1. Combined nomenclature codes for used textiles
The combined nomenclature (CN) is a product classification system used in export declarations and in statistical declarations for trade in the European community.
Codes for used textiles exported from the EU are classified into two main product codes under the CN product code system: 6309 (worn textiles and clothing) and 6310 (sorted and unsorted used rags and textile scraps). In general, code 6309 should be given to textiles fit for reuse (second hand), while code 6310 should be used for textiles unfit for reuse that may or may not already have been processed; for example, recycled into other products such as industrial rags.
There is no code for textile waste export. However, textiles are on the European List of Waste (EU, 2015), and national authorities are therefore required to assess whether the used textiles that are to be exported should be classified as waste or not. As a rule of thumb, textiles under code 6309 (i.e. worn textiles and clothing) are rarely considered waste, while textiles under code 6310 (i.e. sorted and unsorted used rags and textile scraps) might be considered waste (Watson et al., 2016).
In the last two decades, the EU has mainly exported used textiles classified as 6309 (i.e. worn textiles and clothing) and only small amounts of textiles classified as 6310 (i.e. sorted and unsorted used rags and textile scraps). Charitable and private collectors in most countries typically want to receive only reusable textiles and do pre-sorting to extract high-value textiles, so-called ‘cream’, to sell in their own shops (Köhler et al., 2021). Yet a large amount of used textiles is exported unsorted as so-called ‘originals’ and is likely to contain both items fit and unfit for reuse. Wholesalers do not always have a clear idea of what finally happens to the textiles they export for reuse elsewhere in the world (Köhler et al., 2021; Trzepacz et al., 2023).
Batches of ‘originals’ are likely to be classified under code 6309, even though they might contain rags and scraps (Watson et al., 2016). In other words, classification does not necessarily describe the true state of what is exported. Because of this uncertainty, and because code 6310 makes up a small part of the total exports, the remainder of this briefing mostly disregards the difference between the two commodity codes and instead looks at exports as a whole.
Although used textile exports from the EU have been increasing, in 2019, the EU was no longer the most important exporting region in the world. In 2000, the EU was responsible for more than 45% of the total exports of used textiles worldwide; however, its share has declined since. In 2019, Asia (37%) exported more used clothing than the EU (33%) (Figure 2).
Figure 2. Total exports of used textiles by region, 2000, 2010 and 2019, percentage by weight
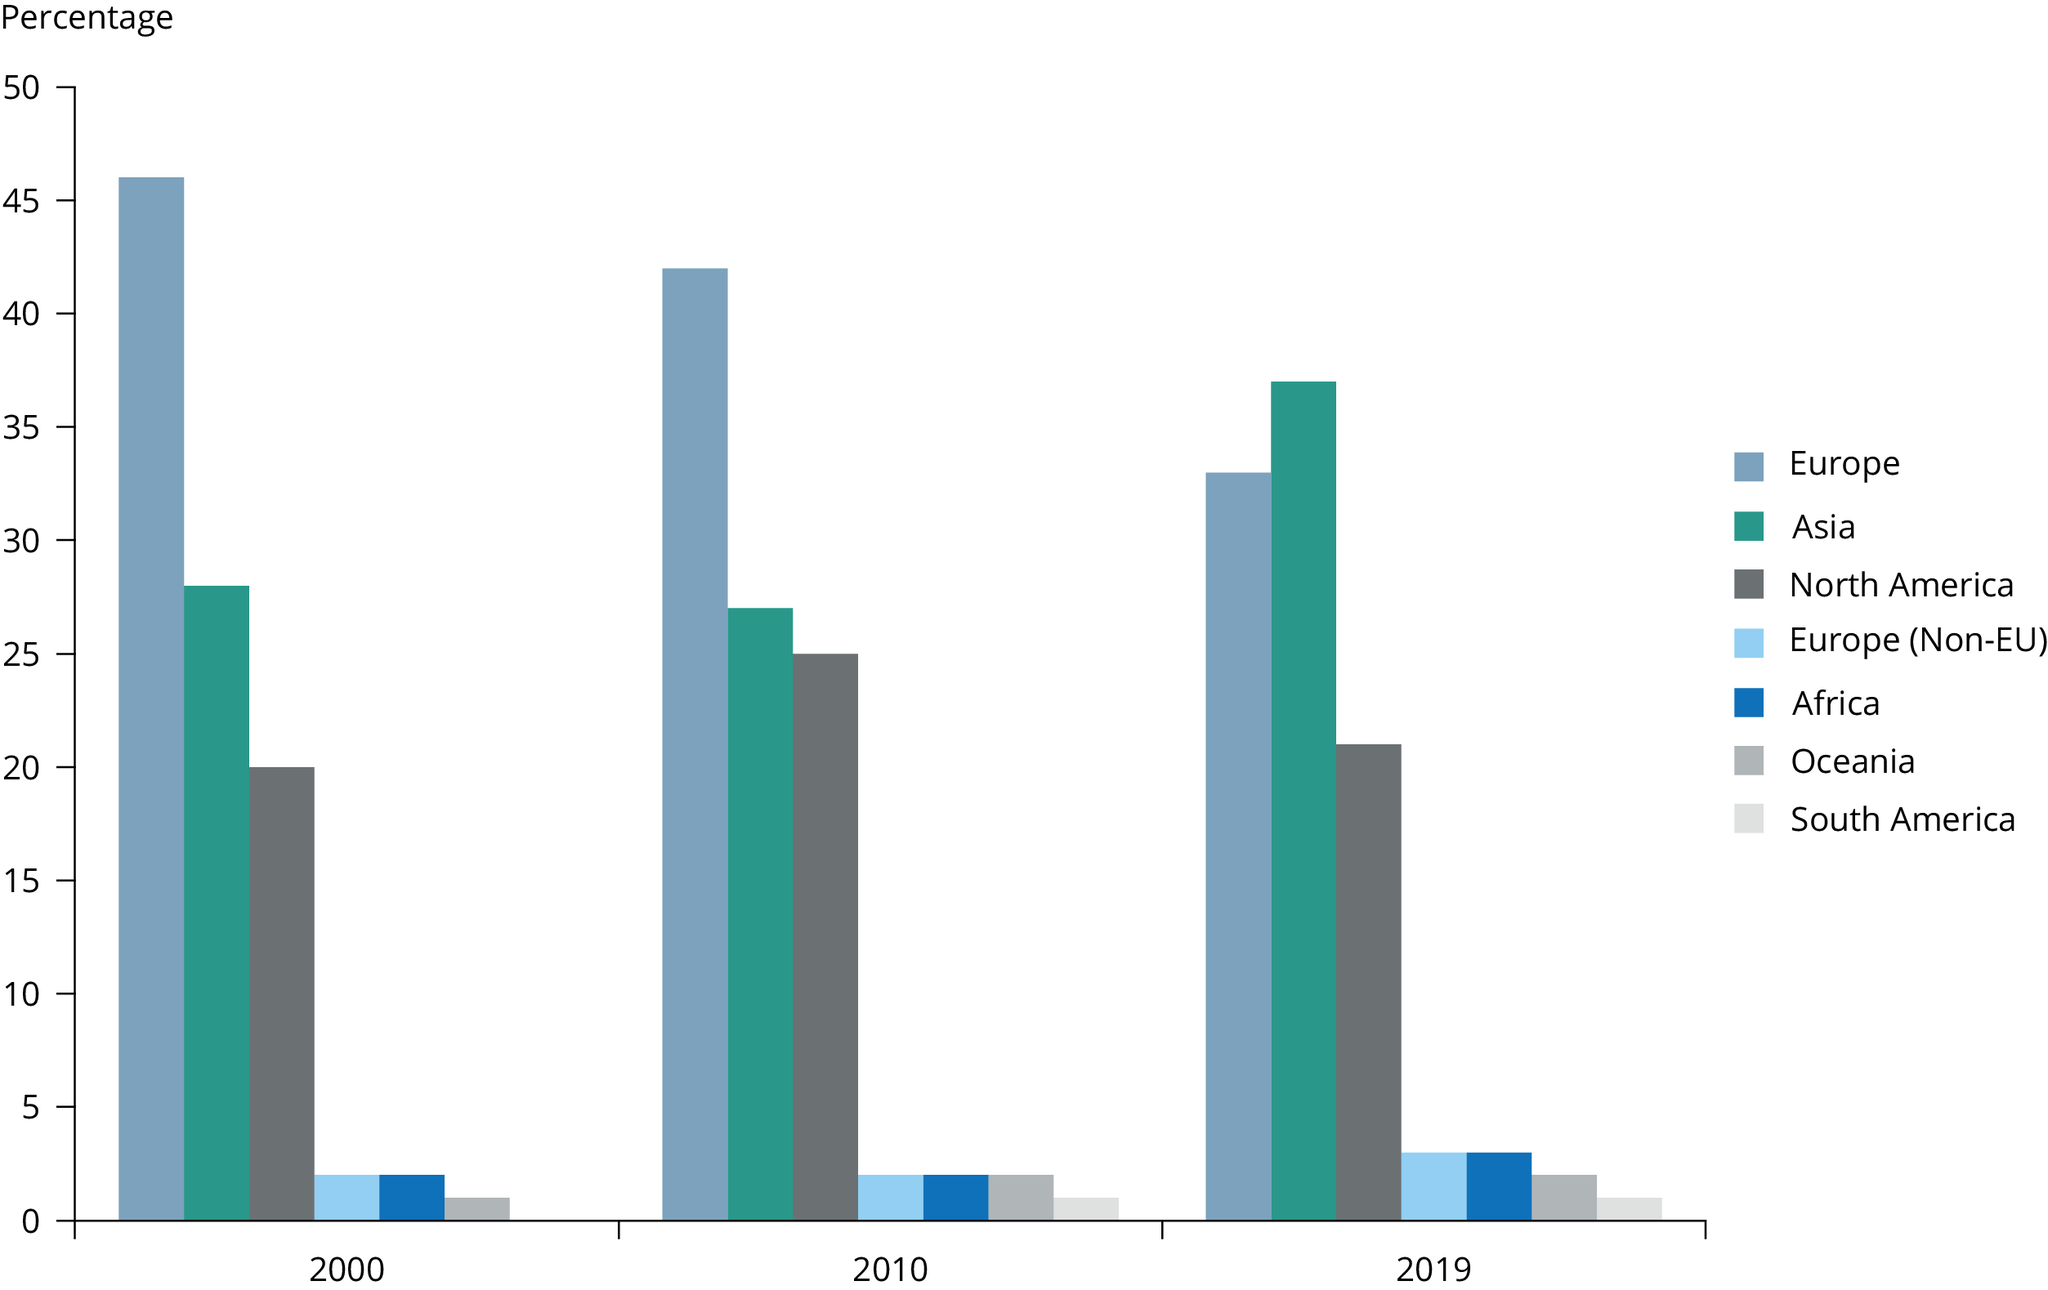
Source: (UN Comtrade, 2022e).
Explore different chart formats and data here
Some EU countries, such as Germany, Poland and the Netherlands, have exported more than others and seem to have acted as import-export hubs for used textiles from the EU, as explained in Box 2.
There is no clear reason explaining why five out of 27 EU Member States and the United Kingdom account for around 75% of all EU used textile exports. It could be partly because these countries are discarding more used textiles because they have better collection systems than other countries, or because they have less internal reuse. On average, 38% of used textiles are collected separately in the EU, but there are large differences between countries. For instance, only 12% were collected in Spain, but 60% were collected in Germany (Fashion for Good, 2022). However, researchers have found that used textiles are subject to intricate trade between EU Member States before leaving the region. Therefore, it is likely that the largest exporters have been sending used textiles abroad, collected locally and from other EU countries (Fashion for Good, 2022; Watson et al., 2016). Thus, another reason for the concentration of exports in a few EU countries could be that these large exporting countries are acting as export hubs; in other words, they are importing used textiles from other EU Member States for re-export beyond the EU. Ports/harbours for international shipment in some of these countries make them logical export hubs.
Box 2. Understanding the used textile trade dynamics in the EU
It is not within the scope of this briefing to explore the trade in used textiles in the EU and why certain countries appear to act as import-export hubs for used textiles. There are, however, indications that it might be related to the benefits of specialisation, economies of scale and the presence of harbours. Denmark, Finland and Sweden, for instance, do not have significant wholesale/sorting capacity, whereas the Netherlands and Poland have a large wholesale and sorting sector (Köhler et al., 2021). Germany also does not have sufficient sorting capacity locally compared to what is collected, and in the Netherlands, most of the local sorting capacity is used to sort textiles from Germany (Fashion for Good, 2022). Furthermore, Belgium, Italy and the Netherlands have large export harbours.
As sorting is a manual and labour-intensive process, it is more economical to do it in countries with lower labour costs, such as Poland (Fashion for Good, 2022). As the market is characterised by tight margins, saving on labour costs can make the difference between operating with or without a profit.
More about intra-EU trade dynamics can be read in the recent report from Circle Economy and Fashion for Good.
Countries receiving used textiles from the EU
Throughout the past two decades, Africa has been the main continent receiving used textiles from the EU, importing more than 60% of EU exports. While in 2000, Asia received only 26% of EU exports, by 2019, it had significantly increased its share to 41% of EU imports. This is almost equal to Africa, which still imported 46% of EU exports. Non-EU European countries have imported a small proportion of EU used textiles, around 10%, which has remained relatively constant over the years (Figure 3).
Figure 3. EU exports of used textiles to other regions, 2000, 2010 and 2019, percentage
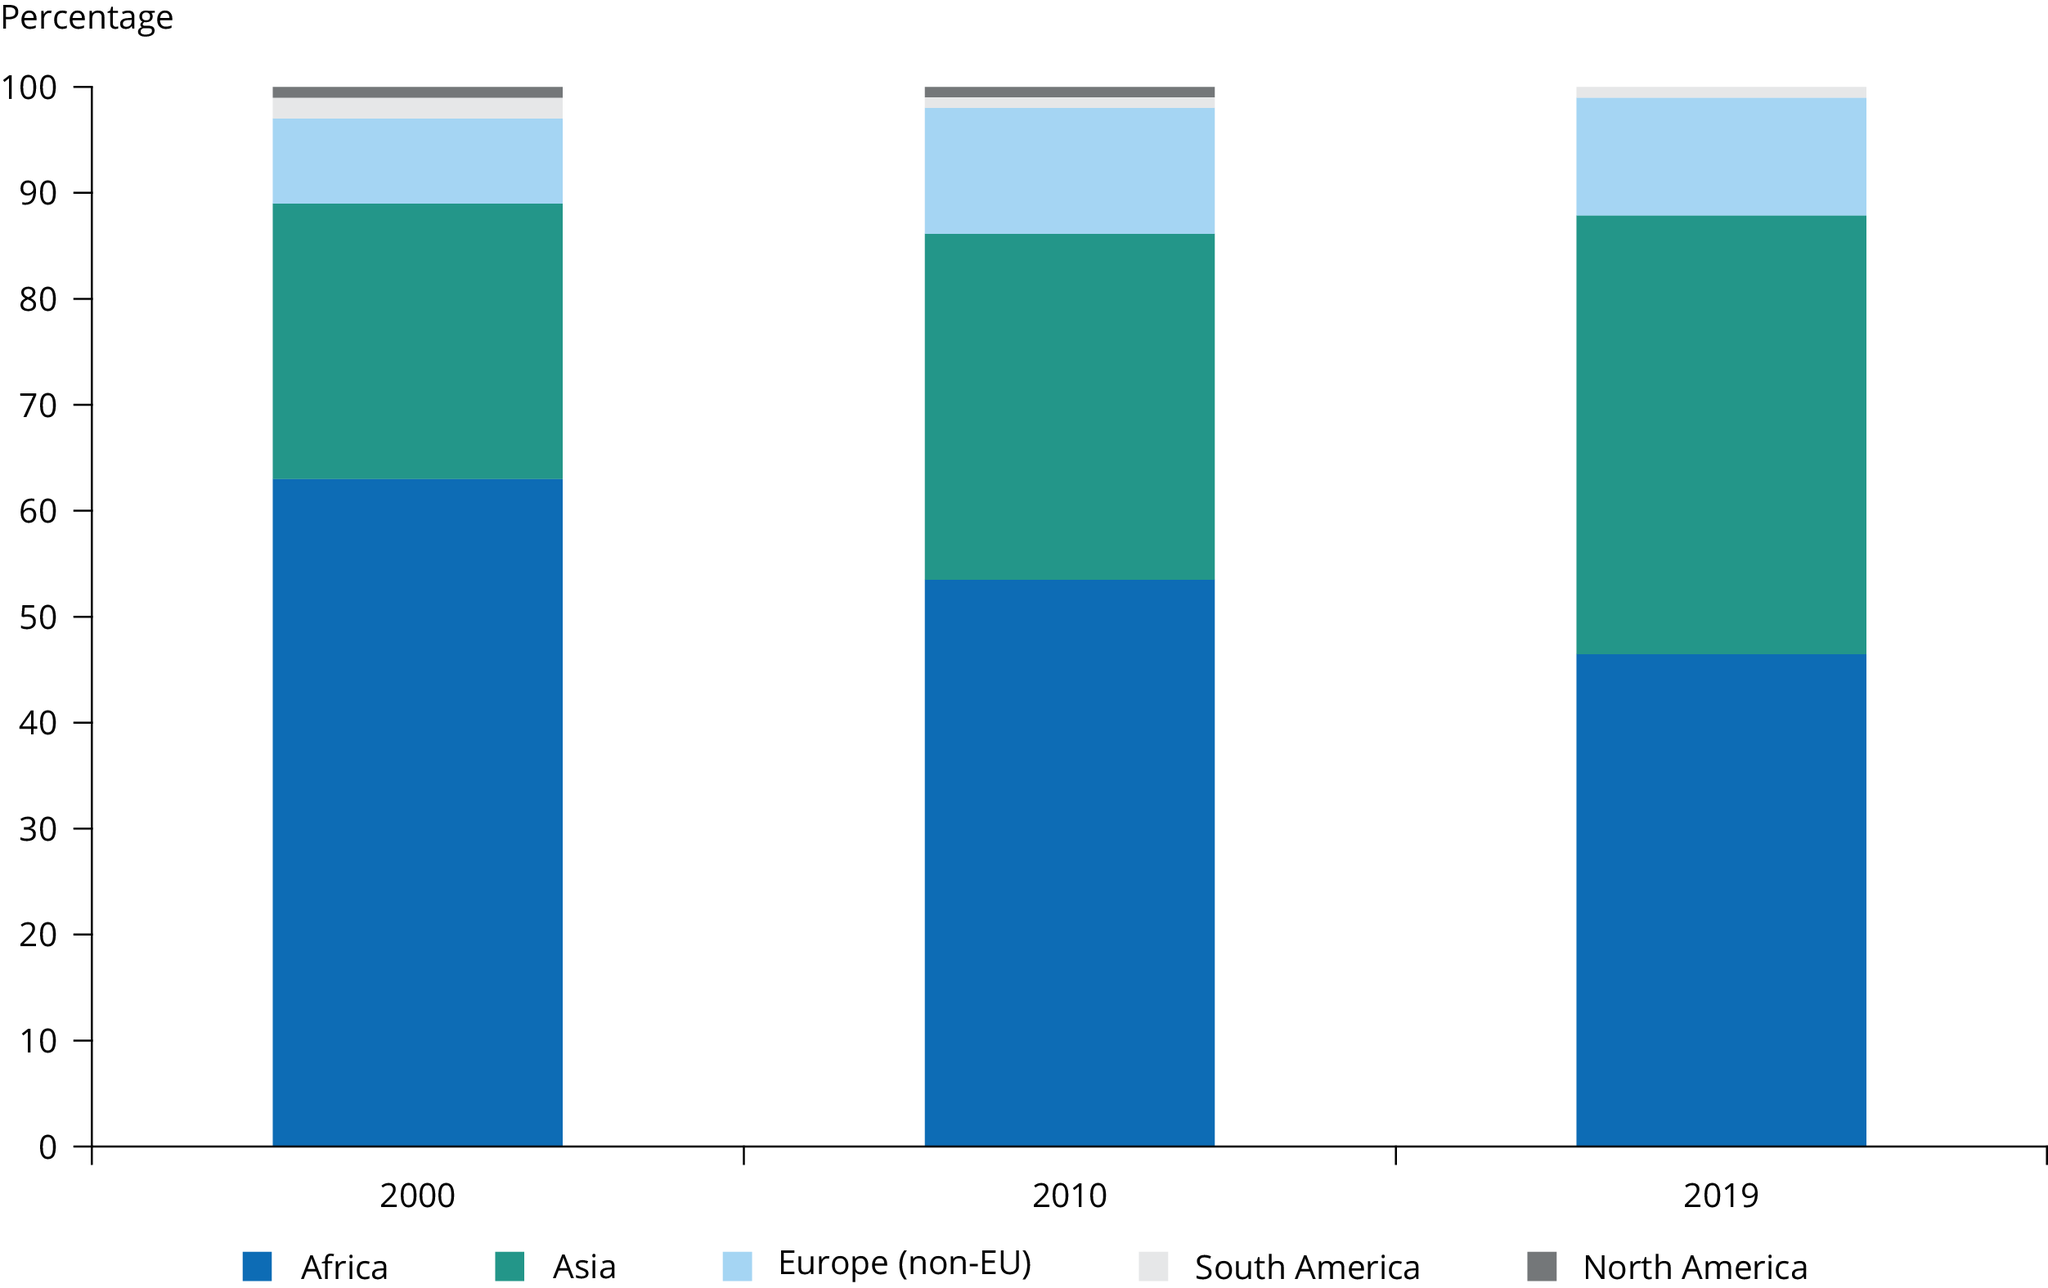
Source: (UN Comtrade, 2022b)
Explore different chart formats and data here
As seen in Figure 4, between 2000 and 2019, more Asian countries rose to the higher end of the top 10 countries receiving EU used textile exports. From 2000 to 2010, Pakistan rose from eighth to first place, and retained that position in 2019. The United Arab Emirates (UAE), which was not part of the list in 2000, was in seventh place in 2010 and in second place in 2019. In 2000, three African countries made up the top five countries receiving EU used textile exports. Yet in 2019, one African, one European and three Asian countries formed the top five.
A shift is seen not only in which countries make up the top 10 receiving countries, but also in the size of their shares. In 2000, the top 10 receiving countries imported 54.6% of all EU used textiles, whereas in 2019, they imported 64%. This suggests that specialisation in importing textiles is taking place.
Figure 4. EU exports of used textiles, by receiving country, 2000, 2010 and 2019, million kilograms
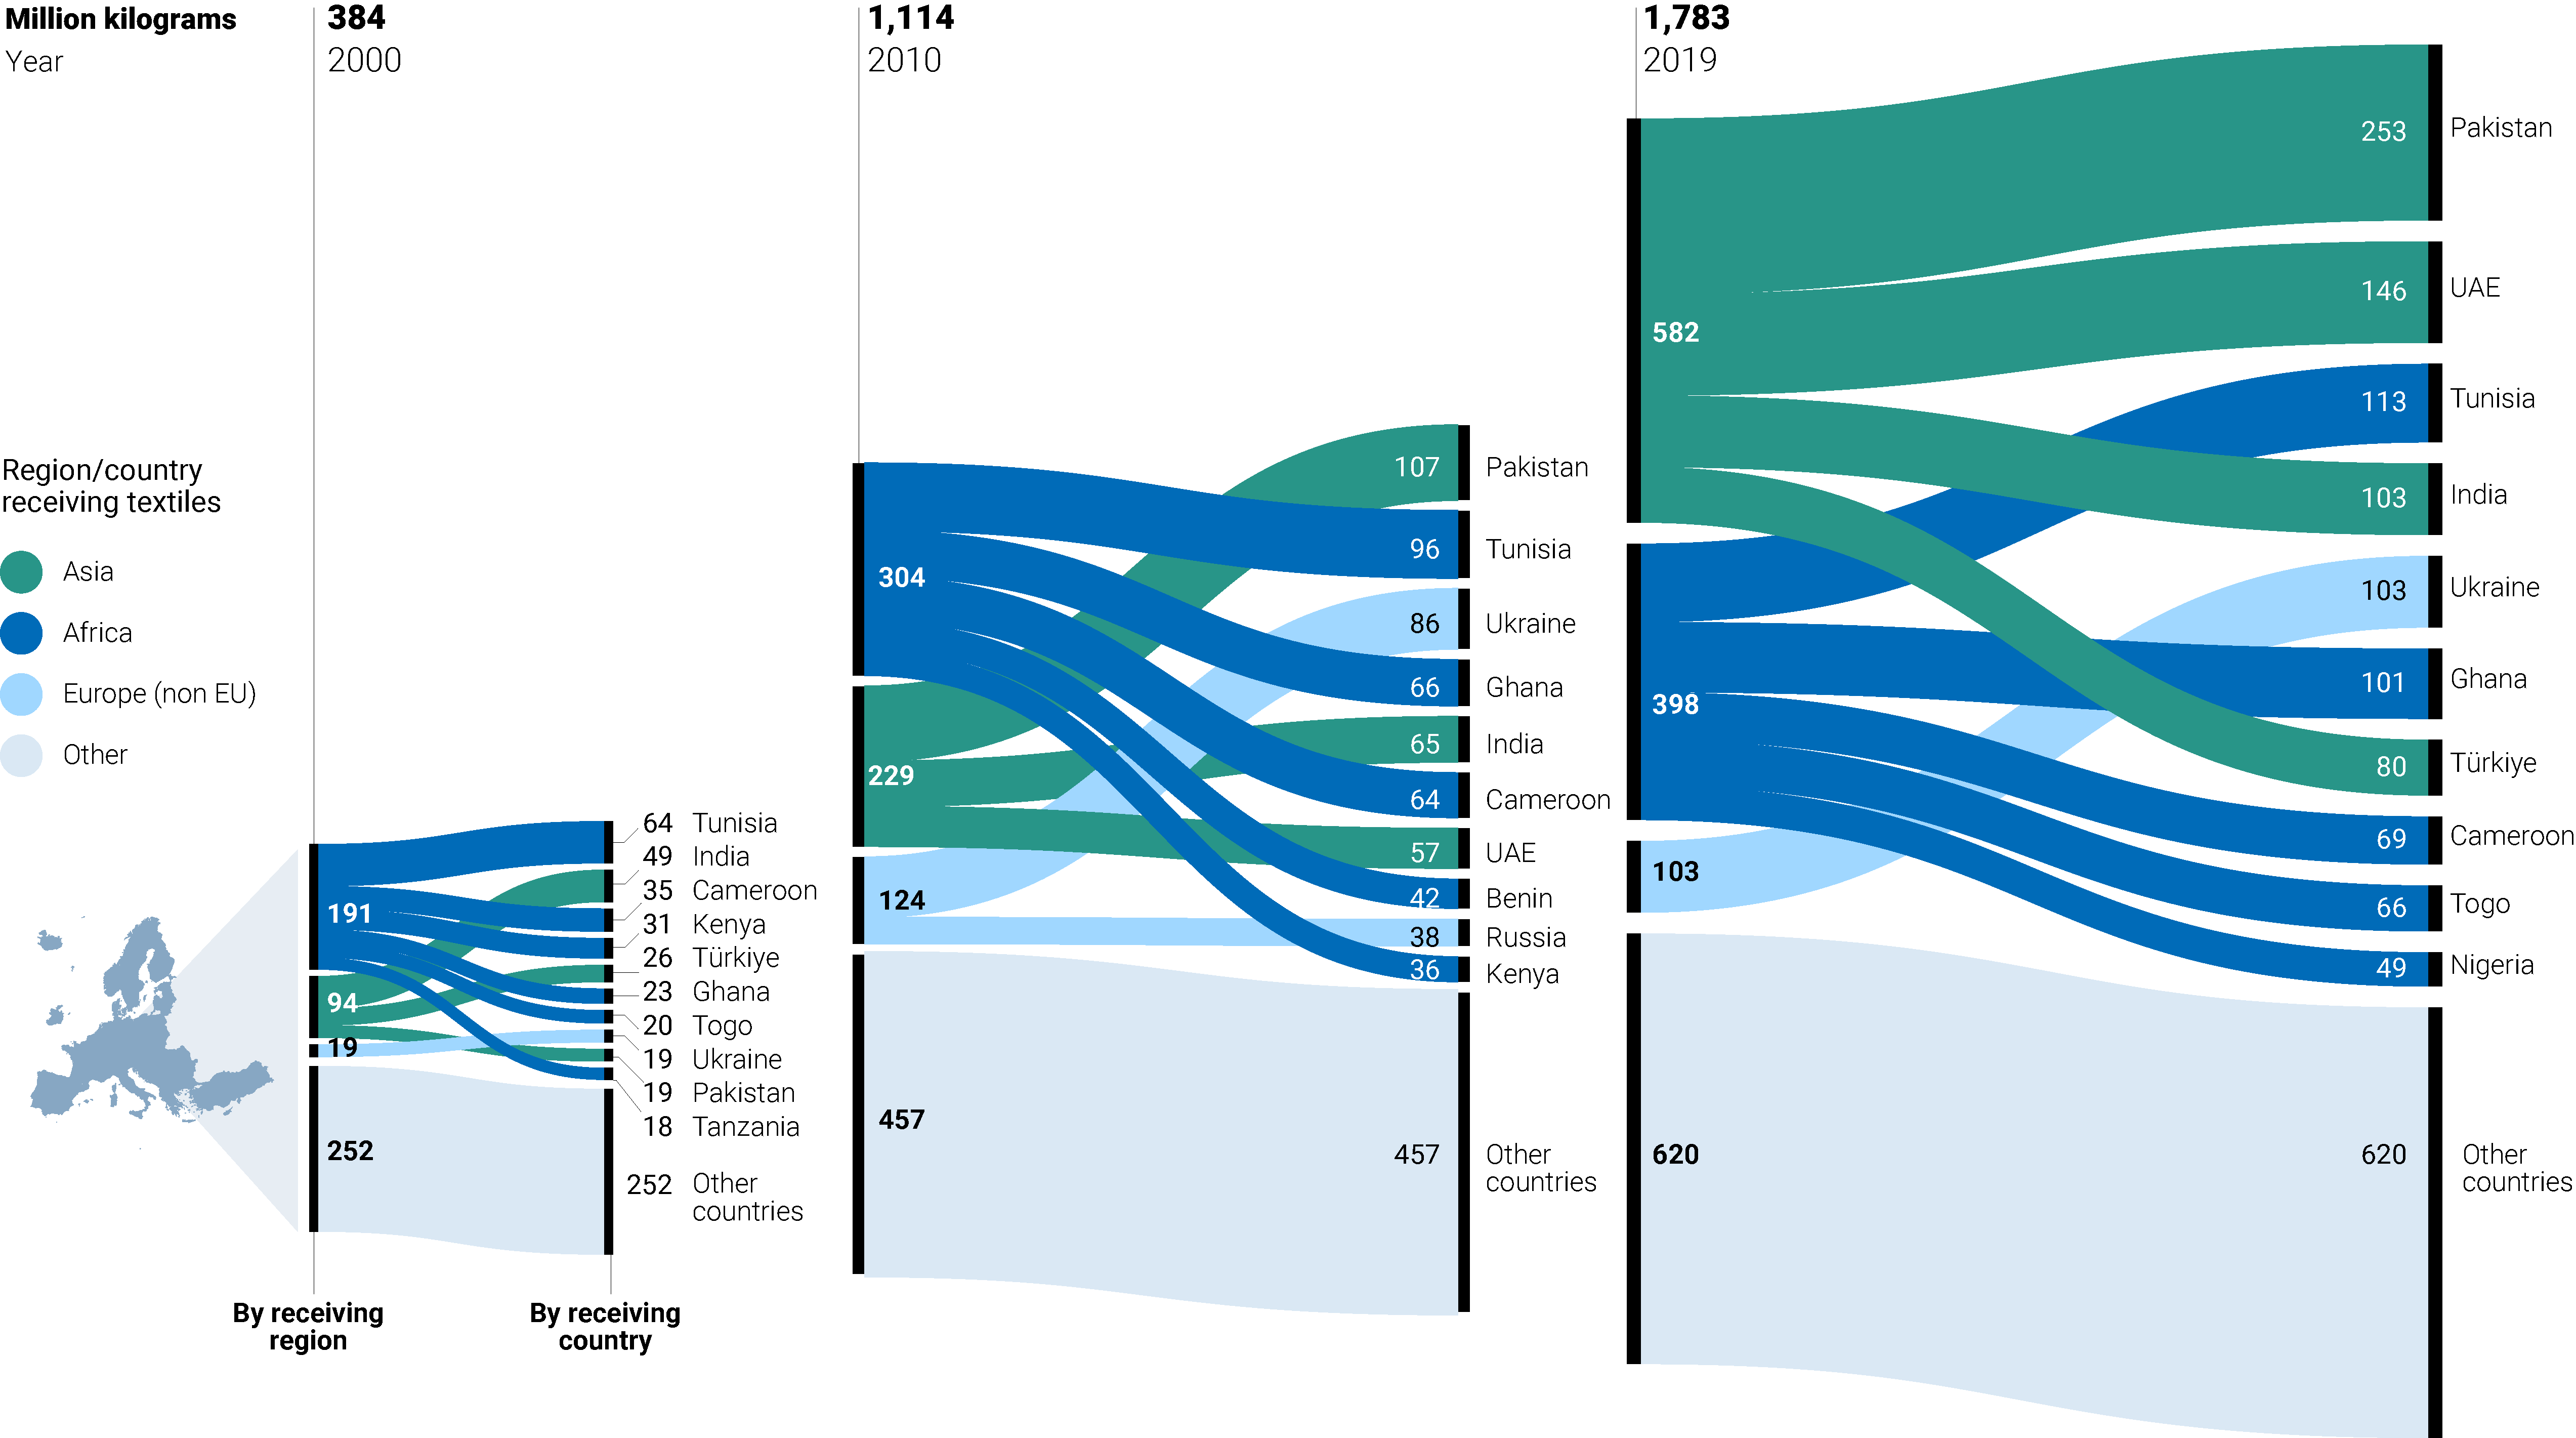
Source: (UN Comtrade, 2022c)
The fate of EU-exported used textiles in receiving countries is highly uncertain as limited and mostly anecdotal evidence is available. The findings summarised below are based on analysing different sources, and an overview and discussion of the available information is included in the underpinning report.
In the African countries studied, the import of used textiles seems to be mainly meant for local reuse. This is because there is a demand for cheap, used clothes from Europe, which seem to be preferred to new items. What is not fit for reuse mostly ends up in open landfills and informal waste streams. Several African countries have been debating banning used textile imports as a way to protect and strengthen local textile production (Sustainable Amor, 2020). This indicates that imports also bring negative social and environmental impacts.
In Asia, however, most of the used textiles are imported to so-called economic zones where they are sorted and processed. In the countries studied for this briefing, import for local reuse is restricted. Instead, used textiles seem to be recycled locally, mostly downcycled into industrial rags or filling, or re-exported either for recycling in other Asian countries or reuse in Africa. Textiles that cannot be recycled or re-exported are likely to end up in the general waste management system, most of which is landfilling.
Reflections on EU exports of used textiles
EU used textile exports have grown significantly over the two last decades. The exports are a mix of textiles that can, in principle, be reused in the receiving countries. However, in reality, they may be landfilled: textiles that cannot be reused typically end up being downcycled or disposed of in landfills or dumps. There is a lot of uncertainty around what share of textiles can be reused and what cannot as the combined nomenclature (CN) codes for export do not make this distinction clear. There is little research or information on the actual reuse rate in the receiving countries, the share of used textiles that ends up as waste, and the specific waste management systems and their abilities to handle the used textiles that cannot be reused in a sustainable way. Both the EU and the destination countries need to address the challenges around the growing amounts of exported used textiles and the overall uncertainty about their fate.
Figure 5. Flow of used textiles collected in the EU
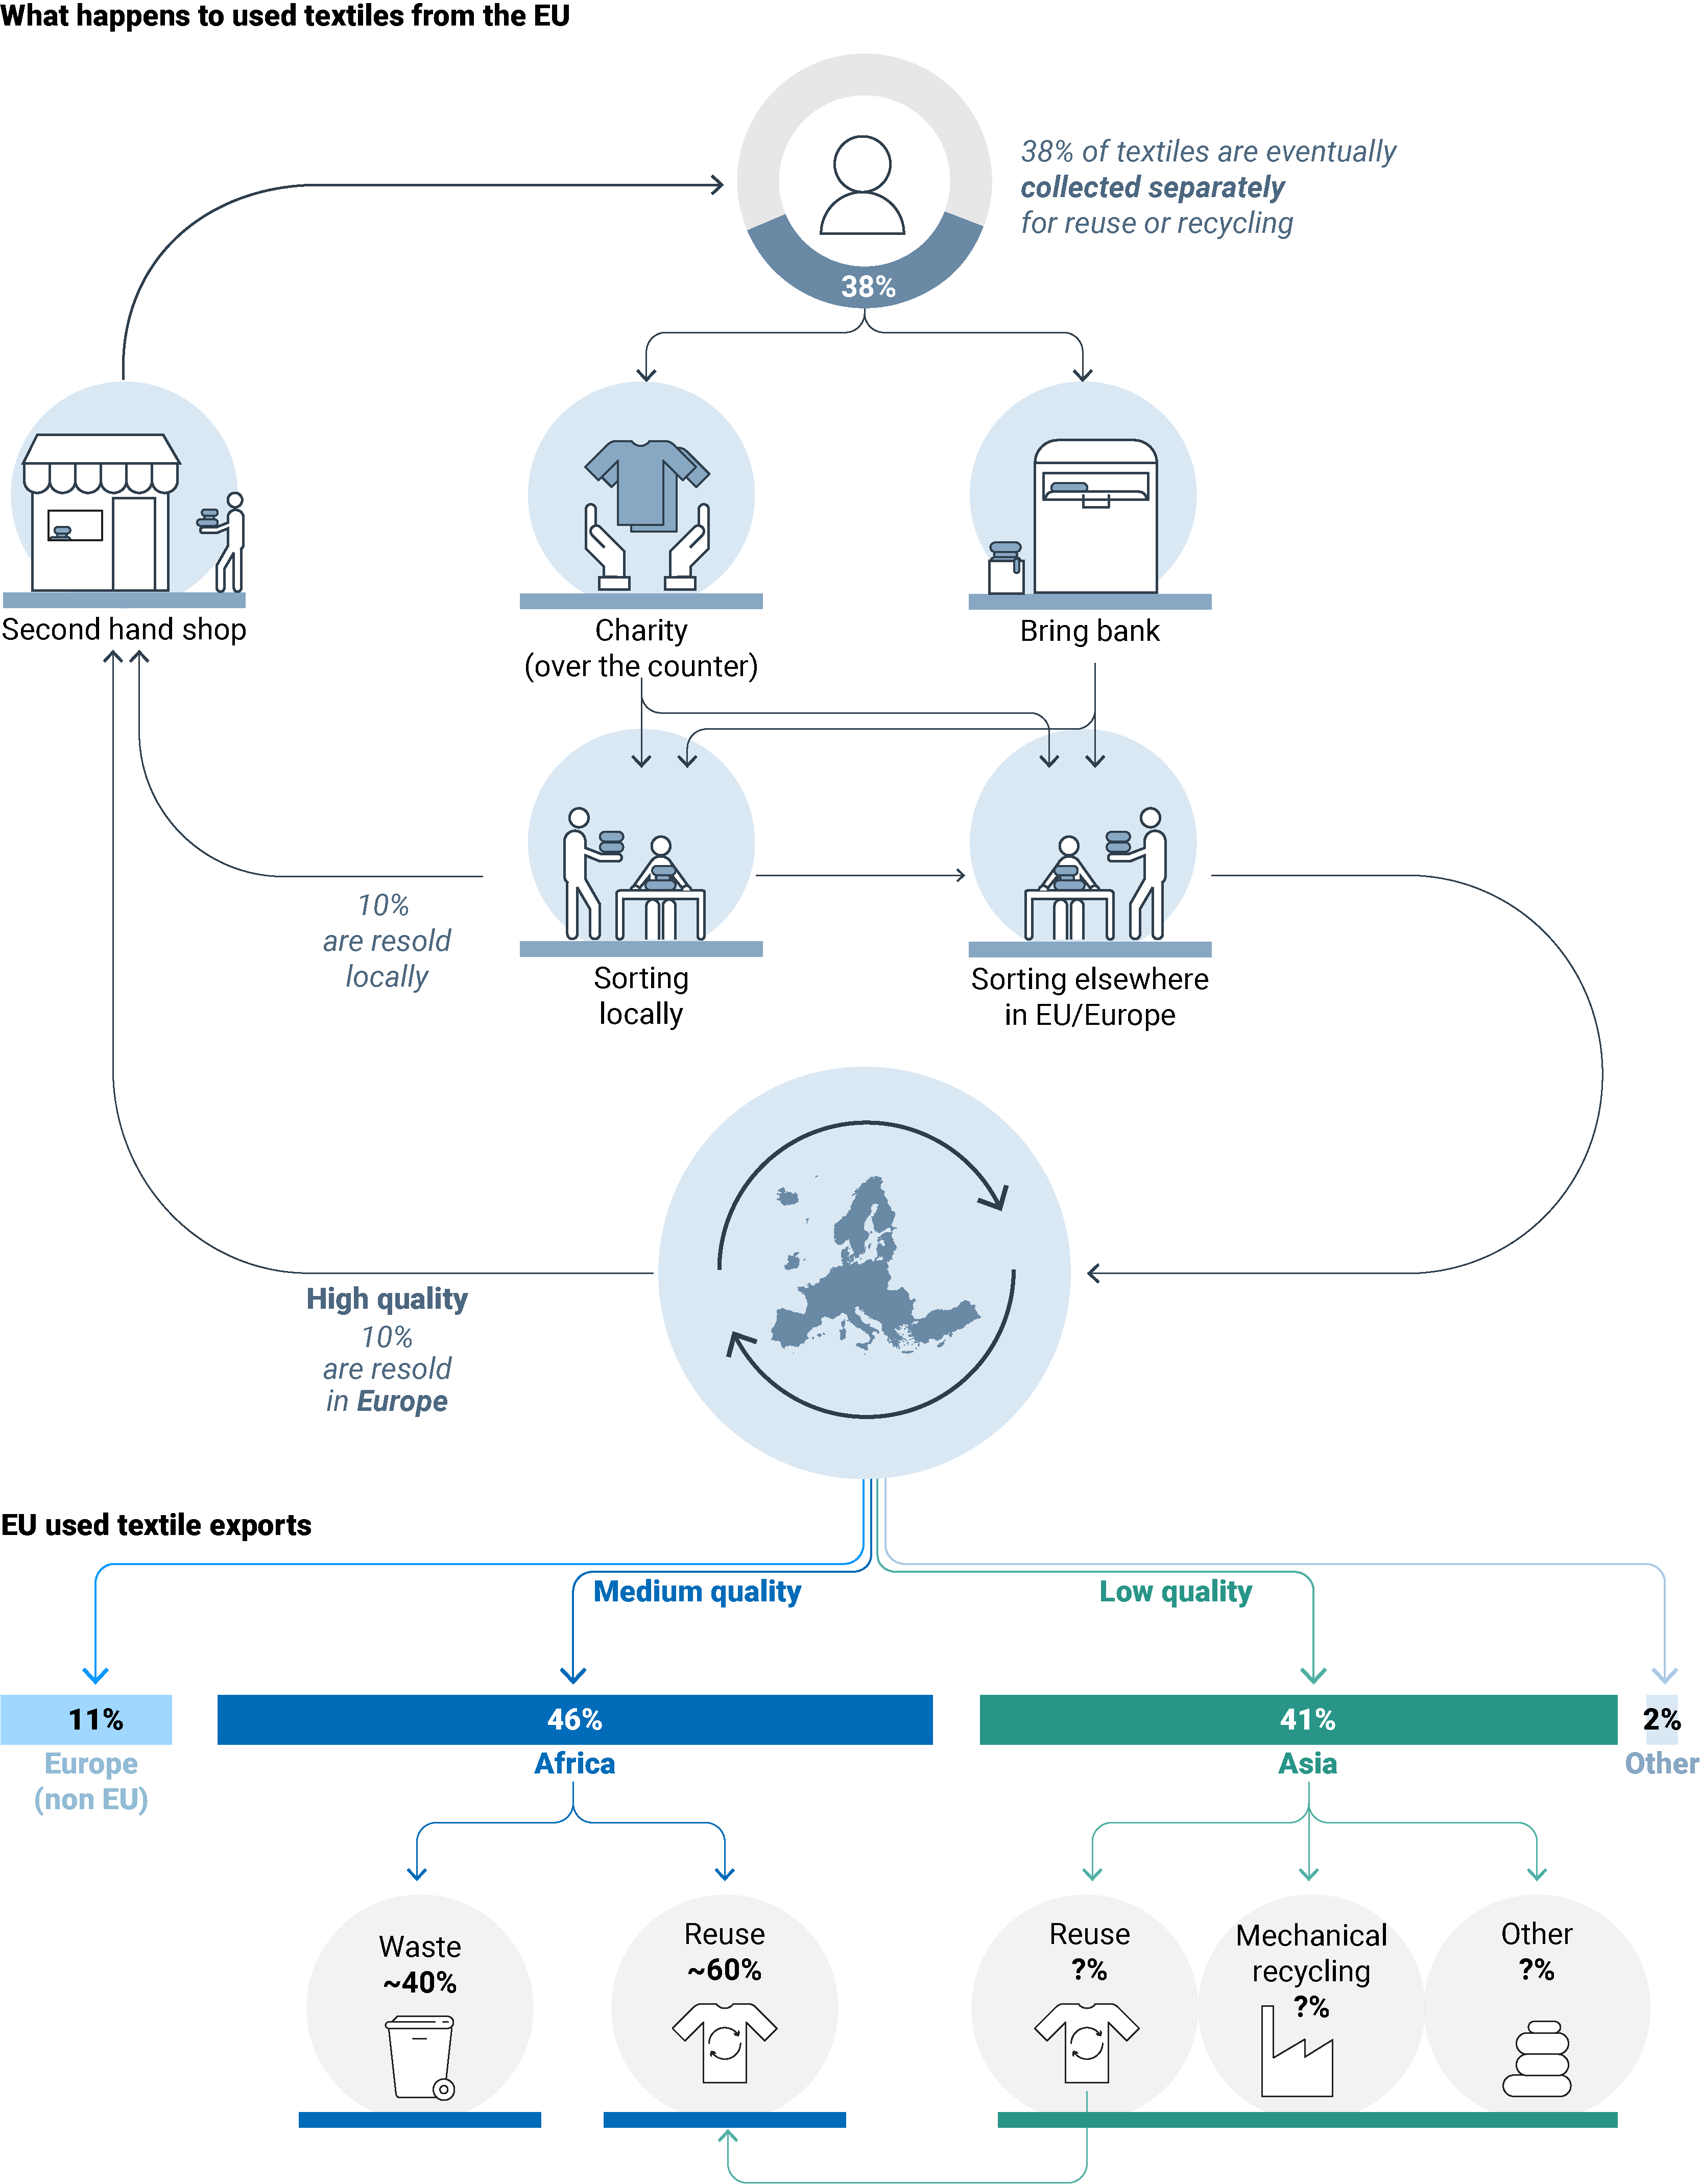
Sources: (Köhler et al., 2021) (Fashion for Good, 2022) (Watson et al., 2016).
In the EU strategy on sustainable and circular textiles, published in March 2022, the need for addressing the challenges from exports is specifically mentioned (see Box 3). The European Parliament is also expected to address this.
Box 3. EU used textile exports in the EU textiles strategy
The following text on EU used textile exports appears in the EU strategy on sustainable and circular textiles, published in March 2022 (EC, 2022):
Addressing the challenges from the export of textile waste
Exports of textile waste outside the EU have been steadily increasing to reach 1.4 million tonnes in 2020. Under the recent Commission proposal for new EU rules on the shipment of waste, the export of textile waste to non-OECD countries would be allowed only under the condition that such countries notify to the Commission their willingness to import specific types of waste and demonstrate their ability to manage it sustainably.
To avoid that waste streams are falsely labelled as second-hand goods when exported from the EU and in this way escape the waste regime, on the basis of an empowerment foreseen in the proposal, the Commission will consider the development of specific EU level criteria to make a distinction between waste and certain second-hand textile products. A call under LIFE has been launched to improve the traceability of exports of used textiles and textile waste.
The Commission will also work to increase transparency and sustainability in global trade in textile waste and used textiles. At bilateral level, the EU will be intensifying its cooperation on issues of common interest related to textile waste shipment through its dialogues on the environment with third countries and regions, as well as in the context of the sustainable development chapters of the EU bilateral and region-to-region trade agreements, where relevant, in line with the overall EU objectives to increase the sustainability dimension of its trade policy.
This briefing and its underpinning report identify a range of issues for further investigation.
EU used textile exports are characterised by a lot of uncertainty. First, there is uncertainty around the types of textiles exported as well as their quality. There is also a lack of consistent data on the quantities and fate of used textiles and textile waste in Europe. Different countries collect and classify textiles in various ways, and the UN Comtrade commodity codes for and statistics on used textiles do not necessarily reflect the quality and fate of exported textiles. Furthermore, there are signs that Asian importers re-export part of what they import; as a result, the picture becomes increasingly unclear. A better understanding of where the used textiles go after the first receiving country is crucial for identifying what ultimately happens to used textiles exported from the EU.
The reuse and recycling of textiles come with considerable environmental benefits by offsetting new textile production (Sandin and Peters, 2018; Trzepacz et al., 2023). In the case of used textile exports, however, the supposed reuse is taking place outside Europe (Sandin and Peters, 2018; Trzepacz et al., 2023). Not only can this kind of ‘outsourced reuse’ be questioned, given the fact that there seems to be a lack of interest in reusing these garments in Europe: it also comes with a high degree of uncertainty about the actual level of reuse and recycling. The avoided environmental impacts related to reuse depend on whether this reuse actually replaces new textile or fibre production. In other words, if used textiles exported from the EU are of too low quality to be reused, are not reused for very long or do not replace new clothing purchases, they may not really replace new production or benefit the environment. Instead, the exports will only lead to more textiles ending up as waste. Given the limited waste management facilities in many receiving countries, the situation may be worse: these exported textiles may cause even more environmental damage than if they were sent to recycling or waste incineration in Europe in the first place. However, this needs further research.
The quality of textiles exported from the EU, and how this impacts their fate, is important. Yet it is also complex and warrants further research, data and knowledge. It is particularly important to get a better understanding of the ‘market fit’ between what is exported and the needs of the receiving countries to reduce the risk of exported reusable or recyclable items going to waste. In addition, there needs to be better understanding around available sorting and recycling capacities and their ability to deal with clothing unfit for reuse. Ultimately, this would help avoid improper waste management and landfilling.
References
EC, 2022, Communication from the Commission to the European Parliament, the Council, the European Economic and Social Committee and the Committee of the Regions: EU strategy for sustainable and circular textiles (COM(2022) 141 final).
EEA, 2022, Textiles and the environment: the role of design in Europe’s circular economy, EEA Briefing, European Environment Agency (https://www.eea.europa.eu/publications/textiles-and-the-environment-the) accessed 29 September 2022.
EU, 2015, Commission Decision of 3 May 2000 replacing Decision 94/3/EC establishing a list of wastes pursuant to Article 1(a) of Council Directive 75/442/EEC on waste and Council Decision 94/904/EC establishing a list of hazardous waste pursuant to Article 1(4) of Council Directive 91/689/EEC on hazardous waste (notified under document number C(2000) 1147) (Text with EEA relevance) (2000/532/EC) (OJ L 226, 6.9.2000, p. 2-46).
Fashion for Good, 2022, Sorting for Circularity Europe: an evaluation and commercial assessment of textile waste across Europe (https://reports.fashionforgood.com/report/sorting-for-circularity-europe/) accessed 24 October 2022.
Köhler, A., et al., 2021, Circular economy perspectives in the EU textile sector, Publications Office of the European Union, Luxembourg (https://publications.jrc.ec.europa.eu/repository/handle/JRC125110) accessed 31 January 2023.
Sandin, G. and Peters, G. M., 2018, ‘Environmental impact of textile reuse and recycling — a review’, Journal of Cleaner Production184, pp. 353-365 (DOI: 10.1016/j.jclepro.2018.02.266).
Sustainable Amor, 2020, ‘Explaining used clothing import bans’ (https://sustainableamor.com/blog/explaining-used-clothing-import-bans) accessed 25 October 2022.
Trzepacz, S., et al., 2023, LCA-based assessment of the management of European used textiles, EuRIC (https://www.euric-aisbl.eu/position-papers/item/643-study-lca-based-assessment-of-the-management-of-european-used-textiles) accessed 31 January 2023.
UN Comtrade, 2022a, ‘Database’ (https://comtrade.un.org/data) accessed 2 October 2022.
UN Comtrade, 2022b, ‘EU exports of used textiles to other regions, 2000, 2010 and 2019, per cent’ (https://comtrade.un.org/data) accessed 2 October 2022.
UN Comtrade, 2022c, ‘EU27 exports of used textiles, by receiving country, 2000, 2010 and 2019, million kilograms’ (https://comtrade.un.org/data) accessed 2 October 2022.
UN Comtrade, 2022d, ‘Exports of used textiles to the rest of the world, EU28, 2000–2019, by weight (million tonnes) and value (EUR million)’ (https://comtrade.un.org/data) accessed 2 October 2022.
UN Comtrade, 2022e, ‘Total exports of used textiles by region, 2000, 2010 and 2019, per cent by weight’ (https://comtrade.un.org/data) accessed 2 October 2022.
UN Statistics Division, 2022, Statistical Yearbook, Appeendix I – Country and area nomenclature, regional and other groupings, New York, USA.
Watson, D., et al., 2016, Exports of Nordic used textiles: fate, benefits and impacts, TemaNord Report No 2016:558, Nordic Council of Ministers (http://norden.diva-portal.org/smash/get/diva2:1057017/FULLTEXT03.pdf) accessed 31 January 2023.
Identifiers
Briefing no. 01/2023
Title: EU exports of used textiles in Europe’s circular economy
EN HTML: TH-AM-23-002-EN-Q – ISBN: 978-92-9480-543-0 – ISSN: 2467-3196 – doi: 10.2800/037373
EN PDF: TH-AM-23-002-EN-N – ISBN: 978-92-9480-541-6 – ISSN: 2467-3196 – doi: 10.2800/189382
Source
European Environment Agency, press release, 2023-02-27.
Supplier
European Commission
European Environment Agency (EEA)
European Parliament
European Union
Fashion for Good
Share
Renewable Carbon News – Daily Newsletter
Subscribe to our daily email newsletter – the world's leading newsletter on renewable materials and chemicals