Showing 121–140 of 215
-
-
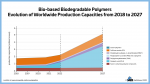
Bio-based biodegradable polymers – Evolution of worldwide production capacities 2018 to 2027 (PNG)
Markets & Economy
1 Page
521 Downloads
-
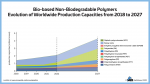
Bio-based non-biod. polymers – Evolution worldwide production capacities 2018-27 (PNG)
Markets & Economy
1 Page
212 Downloads -
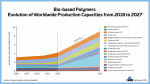
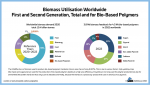
Bio-based polymers – Evolution of worldwide production capacities from 2018 to 2027 (PNG)
Markets & Economy
1 Page
521 Downloads -
-
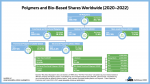
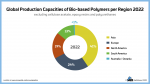
Global Production Capacities of Bio-based Polymers per region 2022 (PNG)
Markets & Economy
1 Page
276 Downloads -
-
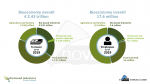
Overall turnover and employment of the bioeconomy and its bio-based industries in the EU-27 in 2019
Markets & Economy
1 Page
127 Downloads -
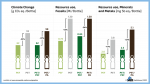
Environmental impacts of 250 ml monolayer and PET/PEF multilayer bottles vs. their fossil counterparts (PNG)
Sustainability & Health, Technology
1 Page
163 Downloads -
-
-
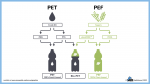
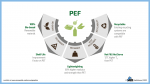
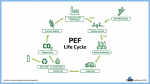
Life cycle stages of monolayer PEF bottles (PNG)
Sustainability & Health, Technology
1 Page
135 Downloads -
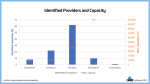
Identified Advanced Recycling technology providers worldwide and maximum capacity (PNG)
Technology
1 Page
340 Downloads -
-
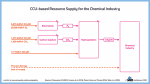
CCU-based Resource Supply for the Chemical Industry (PNG)
Sustainability & Health, Technology
1 Page
253 Downloads -
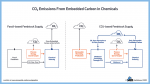
CO₂ Emissions From Embedded Carbon in Chemicals (PNG)
Sustainability & Health, Technology
1 Page
304 Downloads -
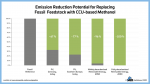
Emission Reduction Potential for Replacing Fossil Feedstock with CCU-based Methanol (PNG)
Sustainability & Health, Technology
1 Page
197 Downloads -
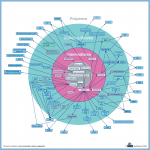
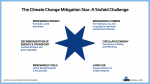
The Climate Change Mitigation Star: A Sixfold Challenge (PNG)
Policy, Sustainability & Health
1 Page
178 Downloads -
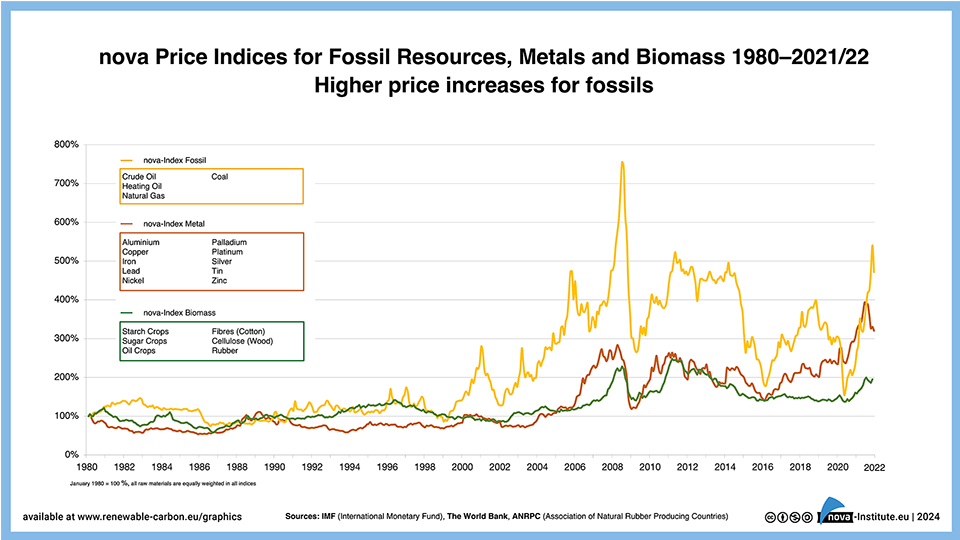
nova Price Indices for Fossil Resources, Metals and Biomass (February 2022) (PNG)
Markets & Economy
1 Page
436 Downloads -
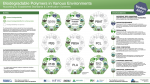
Biodegradable Polymers in Various Environments According to Established Standards and Certification Schemes – Graphic (PNG, Version 2021)
Sustainability & Health, Technology
1 Page
1941 Downloads