Showing 1–20 of 215
-
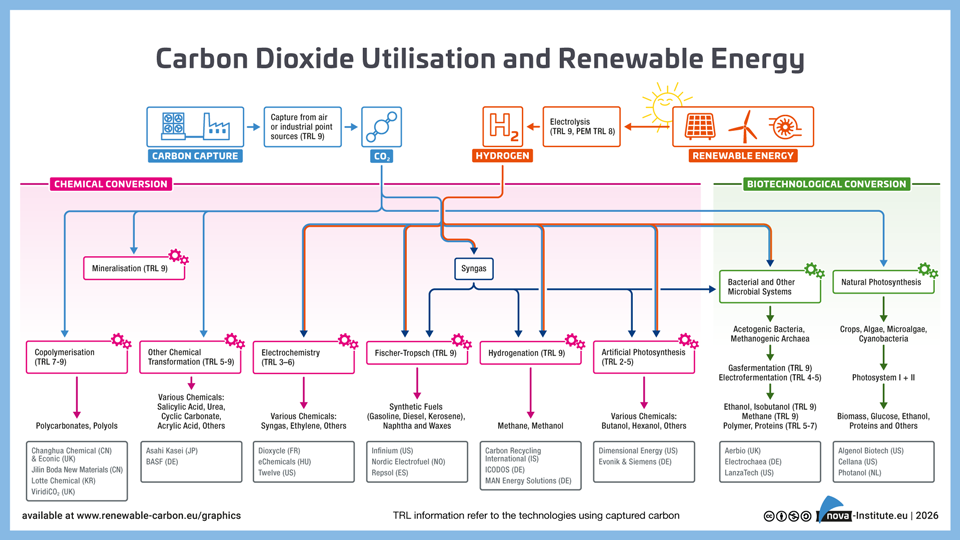
Carbon Dioxide Utilisation and Renewable Energy − Graphic (PNG)
Markets & Economy, Technology
1 Page
24 Downloads
24 Downloads
2026-02
FREE
Free Shipping24
Downloads -
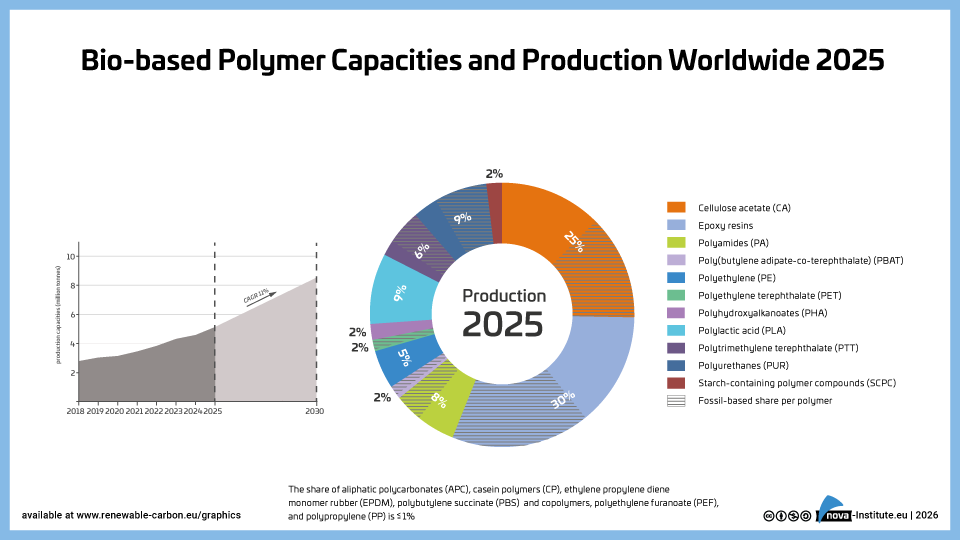
Bio-based Polymer Capacities and Production Worldwide 2025 (PNG)
Markets & Economy
1 Page
25 Downloads 25 Downloads
2026-02
FREE
Free Shipping25
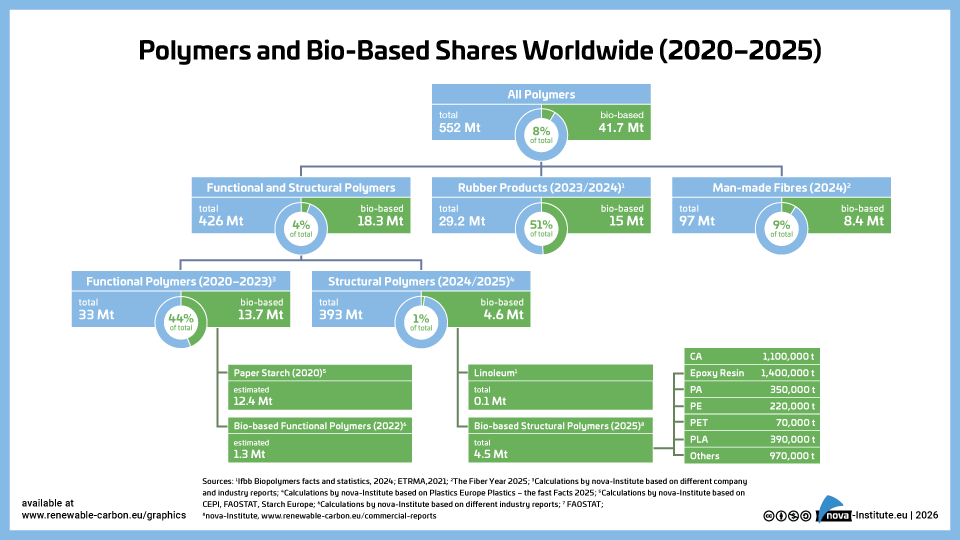
DownloadsThe new high-level report “Bio‑based Building Blocks and Polymers – Global Capacities, Production and Trends 2025–2030”, compiled by the international biopolymer expert group of the nova-Institute, provides an overview of the capacities and production data of 17 commercially available bio‑based building blocks and polymers in 2025, along with a forecast for 2030. Detailed market data is available via individual workshops and webinars with the biopolymer experts. This data includes capacity development from 2018 to 2030, production data for the years 2024 and 2025, and analyses of market developments per building block, polymer and producers, as well as a statistical analysis of “Mass Balance and Attribution (MBA)” products available worldwide.
2025 was a solid year for bio-based polymers, with an expected overall CAGR of 11 % to 2030 and an average capacity utilisation rate of 86 %. Overall, bio-based non-biodegradable polymers have larger installed capacities and higher utilisation rates than bio-based biodegradable polymers. While 58 % of the total installed capacities are from bio-based non-biodegradable polymers, 42 % are bio-based biodegradable polymers. Bio-based non-biodegradable have an average utilisation rate of 90 % whereas bio-based biodegradable polymers have an average utilisation rate of 81 %. The expected CAGR for both, bio-based non-biodegradable and biodegradable is similar with 10 % and 11 %, respectively.
Epoxy resin and PUR production is growing moderately at 9 and 8 %, respectively, while PE and PP are increasing by 17 % and 94 %. Also, capacities for the biodegradables PHA and PLA are expected to increase until 2030 by 49 % and 16 %, respectively. Commercial newcomers such as casein polymers and PEF have increased production capacity and are expected to continue to grow significantly until 2030.
DOI No.: https://doi.org/10.52548/PILO4285
-
27 Downloads
2026-02
FREE
Free Shipping27
DownloadsThe new high-level report “Bio‑based Building Blocks and Polymers – Global Capacities, Production and Trends 2025–2030”, compiled by the international biopolymer expert group of the nova-Institute, provides an overview of the capacities and production data of 17 commercially available bio‑based building blocks and polymers in 2025, along with a forecast for 2030. Detailed market data is available via individual workshops and webinars with the biopolymer experts. This data includes capacity development from 2018 to 2030, production data for the years 2024 and 2025, and analyses of market developments per building block, polymer and producers, as well as a statistical analysis of “Mass Balance and Attribution (MBA)” products available worldwide.
2025 was a solid year for bio-based polymers, with an expected overall CAGR of 11 % to 2030 and an average capacity utilisation rate of 86 %. Overall, bio-based non-biodegradable polymers have larger installed capacities and higher utilisation rates than bio-based biodegradable polymers. While 58 % of the total installed capacities are from bio-based non-biodegradable polymers, 42 % are bio-based biodegradable polymers. Bio-based non-biodegradable have an average utilisation rate of 90 % whereas bio-based biodegradable polymers have an average utilisation rate of 81 %. The expected CAGR for both, bio-based non-biodegradable and biodegradable is similar with 10 % and 11 %, respectively.
Epoxy resin and PUR production is growing moderately at 9 and 8 %, respectively, while PE and PP are increasing by 17 % and 94 %. Also, capacities for the biodegradables PHA and PLA are expected to increase until 2030 by 49 % and 16 %, respectively. Commercial newcomers such as casein polymers and PEF have increased production capacity and are expected to continue to grow significantly until 2030.
DOI No.: https://doi.org/10.52548/PILO4285
-
31 Downloads
2026-02
FREE
Free Shipping31
DownloadsThe new high-level report “Bio‑based Building Blocks and Polymers – Global Capacities, Production and Trends 2025–2030”, compiled by the international biopolymer expert group of the nova-Institute, provides an overview of the capacities and production data of 17 commercially available bio‑based building blocks and polymers in 2025, along with a forecast for 2030. Detailed market data is available via individual workshops and webinars with the biopolymer experts. This data includes capacity development from 2018 to 2030, production data for the years 2024 and 2025, and analyses of market developments per building block, polymer and producers, as well as a statistical analysis of “Mass Balance and Attribution (MBA)” products available worldwide.
2025 was a solid year for bio-based polymers, with an expected overall CAGR of 11 % to 2030 and an average capacity utilisation rate of 86 %. Overall, bio-based non-biodegradable polymers have larger installed capacities and higher utilisation rates than bio-based biodegradable polymers. While 58 % of the total installed capacities are from bio-based non-biodegradable polymers, 42 % are bio-based biodegradable polymers. Bio-based non-biodegradable have an average utilisation rate of 90 % whereas bio-based biodegradable polymers have an average utilisation rate of 81 %. The expected CAGR for both, bio-based non-biodegradable and biodegradable is similar with 10 % and 11 %, respectively.
Epoxy resin and PUR production is growing moderately at 9 and 8 %, respectively, while PE and PP are increasing by 17 % and 94 %. Also, capacities for the biodegradables PHA and PLA are expected to increase until 2030 by 49 % and 16 %, respectively. Commercial newcomers such as casein polymers and PEF have increased production capacity and are expected to continue to grow significantly until 2030.
DOI No.: https://doi.org/10.52548/PILO4285
-
26 Downloads
2026-02
FREE
Free Shipping26
DownloadsThe new high-level report “Bio‑based Building Blocks and Polymers – Global Capacities, Production and Trends 2025–2030”, compiled by the international biopolymer expert group of the nova-Institute, provides an overview of the capacities and production data of 17 commercially available bio‑based building blocks and polymers in 2025, along with a forecast for 2030. Detailed market data is available via individual workshops and webinars with the biopolymer experts. This data includes capacity development from 2018 to 2030, production data for the years 2024 and 2025, and analyses of market developments per building block, polymer and producers, as well as a statistical analysis of “Mass Balance and Attribution (MBA)” products available worldwide.
2025 was a solid year for bio-based polymers, with an expected overall CAGR of 11 % to 2030 and an average capacity utilisation rate of 86 %. Overall, bio-based non-biodegradable polymers have larger installed capacities and higher utilisation rates than bio-based biodegradable polymers. While 58 % of the total installed capacities are from bio-based non-biodegradable polymers, 42 % are bio-based biodegradable polymers. Bio-based non-biodegradable have an average utilisation rate of 90 % whereas bio-based biodegradable polymers have an average utilisation rate of 81 %. The expected CAGR for both, bio-based non-biodegradable and biodegradable is similar with 10 % and 11 %, respectively.
Epoxy resin and PUR production is growing moderately at 9 and 8 %, respectively, while PE and PP are increasing by 17 % and 94 %. Also, capacities for the biodegradables PHA and PLA are expected to increase until 2030 by 49 % and 16 %, respectively. Commercial newcomers such as casein polymers and PEF have increased production capacity and are expected to continue to grow significantly until 2030.
DOI No.: https://doi.org/10.52548/PILO4285
-
Bio-based polymers – Evolution of worldwide production capacities from 2018 to 2030 (PNG)
Markets & Economy
1 Page
27 Downloads 27 Downloads
2026-02
FREE
Free Shipping27
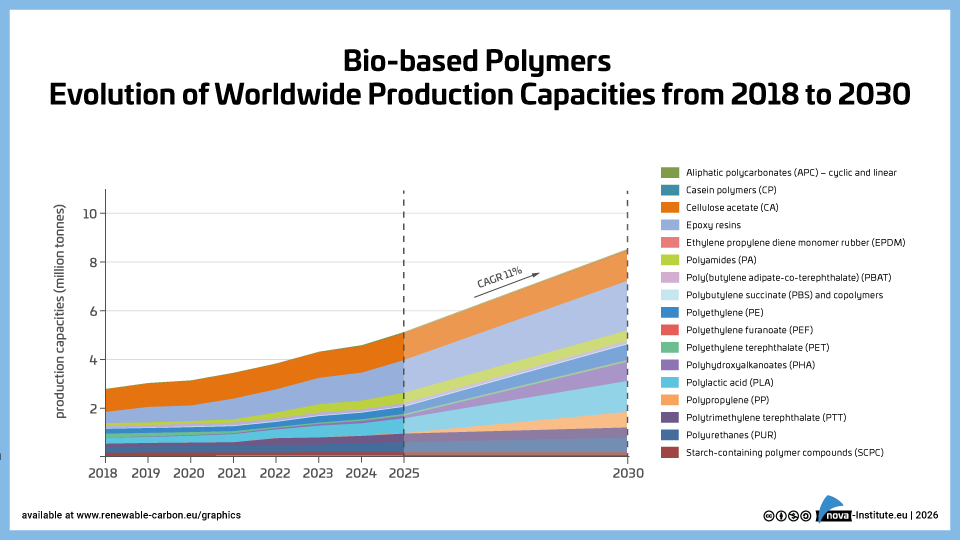
DownloadsThe new high-level report “Bio‑based Building Blocks and Polymers – Global Capacities, Production and Trends 2025–2030”, compiled by the international biopolymer expert group of the nova-Institute, provides an overview of the capacities and production data of 17 commercially available bio‑based building blocks and polymers in 2025, along with a forecast for 2030. Detailed market data is available via individual workshops and webinars with the biopolymer experts. This data includes capacity development from 2018 to 2030, production data for the years 2024 and 2025, and analyses of market developments per building block, polymer and producers, as well as a statistical analysis of “Mass Balance and Attribution (MBA)” products available worldwide.
2025 was a solid year for bio-based polymers, with an expected overall CAGR of 11 % to 2030 and an average capacity utilisation rate of 86 %. Overall, bio-based non-biodegradable polymers have larger installed capacities and higher utilisation rates than bio-based biodegradable polymers. While 58 % of the total installed capacities are from bio-based non-biodegradable polymers, 42 % are bio-based biodegradable polymers. Bio-based non-biodegradable have an average utilisation rate of 90 % whereas bio-based biodegradable polymers have an average utilisation rate of 81 %. The expected CAGR for both, bio-based non-biodegradable and biodegradable is similar with 10 % and 11 %, respectively.
Epoxy resin and PUR production is growing moderately at 9 and 8 %, respectively, while PE and PP are increasing by 17 % and 94 %. Also, capacities for the biodegradables PHA and PLA are expected to increase until 2030 by 49 % and 16 %, respectively. Commercial newcomers such as casein polymers and PEF have increased production capacity and are expected to continue to grow significantly until 2030.
DOI No.: https://doi.org/10.52548/PILO4285
-
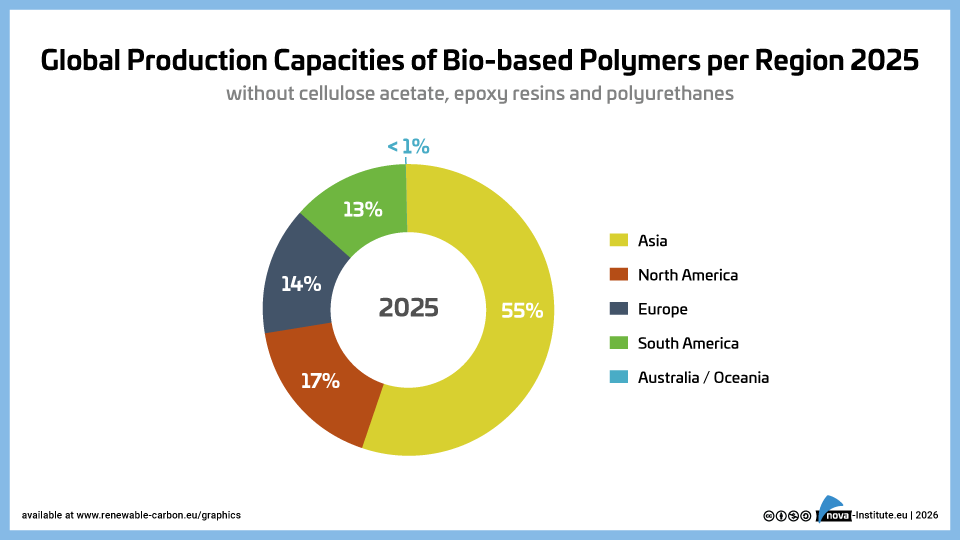
Global Production Capacities of Bio-based Polymers per region 2025 (PNG)
Markets & Economy
1 Page
20 Downloads 20 Downloads
2026-02
FREE
Free Shipping20
DownloadsThe new high-level report “Bio‑based Building Blocks and Polymers – Global Capacities, Production and Trends 2025–2030”, compiled by the international biopolymer expert group of the nova-Institute, provides an overview of the capacities and production data of 17 commercially available bio‑based building blocks and polymers in 2025, along with a forecast for 2030. Detailed market data is available via individual workshops and webinars with the biopolymer experts. This data includes capacity development from 2018 to 2030, production data for the years 2024 and 2025, and analyses of market developments per building block, polymer and producers, as well as a statistical analysis of “Mass Balance and Attribution (MBA)” products available worldwide.
2025 was a solid year for bio-based polymers, with an expected overall CAGR of 11 % to 2030 and an average capacity utilisation rate of 86 %. Overall, bio-based non-biodegradable polymers have larger installed capacities and higher utilisation rates than bio-based biodegradable polymers. While 58 % of the total installed capacities are from bio-based non-biodegradable polymers, 42 % are bio-based biodegradable polymers. Bio-based non-biodegradable have an average utilisation rate of 90 % whereas bio-based biodegradable polymers have an average utilisation rate of 81 %. The expected CAGR for both, bio-based non-biodegradable and biodegradable is similar with 10 % and 11 %, respectively.
Epoxy resin and PUR production is growing moderately at 9 and 8 %, respectively, while PE and PP are increasing by 17 % and 94 %. Also, capacities for the biodegradables PHA and PLA are expected to increase until 2030 by 49 % and 16 %, respectively. Commercial newcomers such as casein polymers and PEF have increased production capacity and are expected to continue to grow significantly until 2030.
DOI No.: https://doi.org/10.52548/PILO4285
-
Bio-based non biodegradable polymers Evolution of Capacities (PNG)
Markets & Economy
1 Page
12 Downloads 12 Downloads
2026-02
FREE
Free Shipping12
DownloadsThe new high-level report “Bio‑based Building Blocks and Polymers – Global Capacities, Production and Trends 2025–2030”, compiled by the international biopolymer expert group of the nova-Institute, provides an overview of the capacities and production data of 17 commercially available bio‑based building blocks and polymers in 2025, along with a forecast for 2030. Detailed market data is available via individual workshops and webinars with the biopolymer experts. This data includes capacity development from 2018 to 2030, production data for the years 2024 and 2025, and analyses of market developments per building block, polymer and producers, as well as a statistical analysis of “Mass Balance and Attribution (MBA)” products available worldwide.
2025 was a solid year for bio-based polymers, with an expected overall CAGR of 11 % to 2030 and an average capacity utilisation rate of 86 %. Overall, bio-based non-biodegradable polymers have larger installed capacities and higher utilisation rates than bio-based biodegradable polymers. While 58 % of the total installed capacities are from bio-based non-biodegradable polymers, 42 % are bio-based biodegradable polymers. Bio-based non-biodegradable have an average utilisation rate of 90 % whereas bio-based biodegradable polymers have an average utilisation rate of 81 %. The expected CAGR for both, bio-based non-biodegradable and biodegradable is similar with 10 % and 11 %, respectively.
Epoxy resin and PUR production is growing moderately at 9 and 8 %, respectively, while PE and PP are increasing by 17 % and 94 %. Also, capacities for the biodegradables PHA and PLA are expected to increase until 2030 by 49 % and 16 %, respectively. Commercial newcomers such as casein polymers and PEF have increased production capacity and are expected to continue to grow significantly until 2030.
DOI No.: https://doi.org/10.52548/PILO4285
-
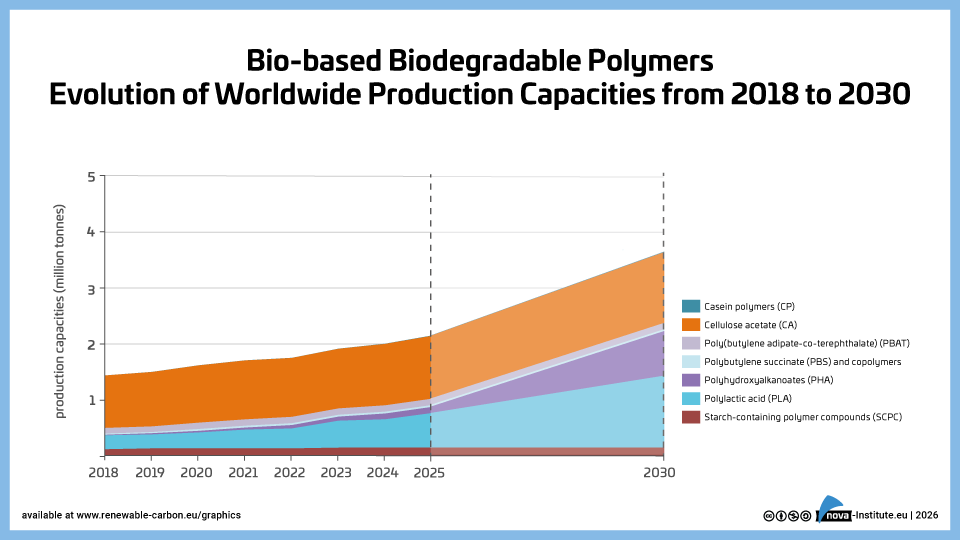
Bio-based biodegradable polymers-Evolution Capacities to 2030 (PNG)
Markets & Economy
1 Page
16 Downloads 16 Downloads
2026-02
FREE
Free Shipping16
DownloadsThe new high-level report “Bio‑based Building Blocks and Polymers – Global Capacities, Production and Trends 2025–2030”, compiled by the international biopolymer expert group of the nova-Institute, provides an overview of the capacities and production data of 17 commercially available bio‑based building blocks and polymers in 2025, along with a forecast for 2030. Detailed market data is available via individual workshops and webinars with the biopolymer experts. This data includes capacity development from 2018 to 2030, production data for the years 2024 and 2025, and analyses of market developments per building block, polymer and producers, as well as a statistical analysis of “Mass Balance and Attribution (MBA)” products available worldwide.
2025 was a solid year for bio-based polymers, with an expected overall CAGR of 11 % to 2030 and an average capacity utilisation rate of 86 %. Overall, bio-based non-biodegradable polymers have larger installed capacities and higher utilisation rates than bio-based biodegradable polymers. While 58 % of the total installed capacities are from bio-based non-biodegradable polymers, 42 % are bio-based biodegradable polymers. Bio-based non-biodegradable have an average utilisation rate of 90 % whereas bio-based biodegradable polymers have an average utilisation rate of 81 %. The expected CAGR for both, bio-based non-biodegradable and biodegradable is similar with 10 % and 11 %, respectively.
Epoxy resin and PUR production is growing moderately at 9 and 8 %, respectively, while PE and PP are increasing by 17 % and 94 %. Also, capacities for the biodegradables PHA and PLA are expected to increase until 2030 by 49 % and 16 %, respectively. Commercial newcomers such as casein polymers and PEF have increased production capacity and are expected to continue to grow significantly until 2030.
DOI No.: https://doi.org/10.52548/PILO4285
-
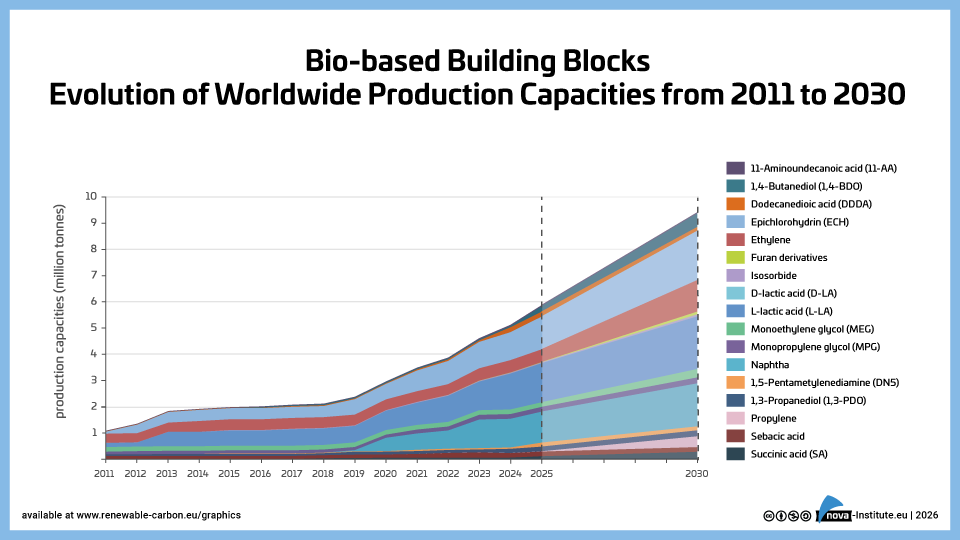
Bio-based building blocks – Evolution of capacities to 2030 (PNG)
Markets & Economy
1 Page
15 Downloads 15 Downloads
2026-02
FREE
Free Shipping15
DownloadsThe new high-level report “Bio‑based Building Blocks and Polymers – Global Capacities, Production and Trends 2025–2030”, compiled by the international biopolymer expert group of the nova-Institute, provides an overview of the capacities and production data of 17 commercially available bio‑based building blocks and polymers in 2025, along with a forecast for 2030. Detailed market data is available via individual workshops and webinars with the biopolymer experts. This data includes capacity development from 2018 to 2030, production data for the years 2024 and 2025, and analyses of market developments per building block, polymer and producers, as well as a statistical analysis of “Mass Balance and Attribution (MBA)” products available worldwide.
2025 was a solid year for bio-based polymers, with an expected overall CAGR of 11 % to 2030 and an average capacity utilisation rate of 86 %. Overall, bio-based non-biodegradable polymers have larger installed capacities and higher utilisation rates than bio-based biodegradable polymers. While 58 % of the total installed capacities are from bio-based non-biodegradable polymers, 42 % are bio-based biodegradable polymers. Bio-based non-biodegradable have an average utilisation rate of 90 % whereas bio-based biodegradable polymers have an average utilisation rate of 81 %. The expected CAGR for both, bio-based non-biodegradable and biodegradable is similar with 10 % and 11 %, respectively.
Epoxy resin and PUR production is growing moderately at 9 and 8 %, respectively, while PE and PP are increasing by 17 % and 94 %. Also, capacities for the biodegradables PHA and PLA are expected to increase until 2030 by 49 % and 16 %, respectively. Commercial newcomers such as casein polymers and PEF have increased production capacity and are expected to continue to grow significantly until 2030.
DOI No.: https://doi.org/10.52548/PILO4285
-
29 Downloads
2026-02
FREE
Free Shipping29
DownloadsThe new high-level report “Bio‑based Building Blocks and Polymers – Global Capacities, Production and Trends 2025–2030”, compiled by the international biopolymer expert group of the nova-Institute, provides an overview of the capacities and production data of 17 commercially available bio‑based building blocks and polymers in 2025, along with a forecast for 2030. Detailed market data is available via individual workshops and webinars with the biopolymer experts. This data includes capacity development from 2018 to 2030, production data for the years 2024 and 2025, and analyses of market developments per building block, polymer and producers, as well as a statistical analysis of “Mass Balance and Attribution (MBA)” products available worldwide.
2025 was a solid year for bio-based polymers, with an expected overall CAGR of 11 % to 2030 and an average capacity utilisation rate of 86 %. Overall, bio-based non-biodegradable polymers have larger installed capacities and higher utilisation rates than bio-based biodegradable polymers. While 58 % of the total installed capacities are from bio-based non-biodegradable polymers, 42 % are bio-based biodegradable polymers. Bio-based non-biodegradable have an average utilisation rate of 90 % whereas bio-based biodegradable polymers have an average utilisation rate of 81 %. The expected CAGR for both, bio-based non-biodegradable and biodegradable is similar with 10 % and 11 %, respectively.
Epoxy resin and PUR production is growing moderately at 9 and 8 %, respectively, while PE and PP are increasing by 17 % and 94 %. Also, capacities for the biodegradables PHA and PLA are expected to increase until 2030 by 49 % and 16 %, respectively. Commercial newcomers such as casein polymers and PEF have increased production capacity and are expected to continue to grow significantly until 2030.
DOI No.: https://doi.org/10.52548/PILO4285
-
21 Downloads
2025-12
FREE
Free Shipping21
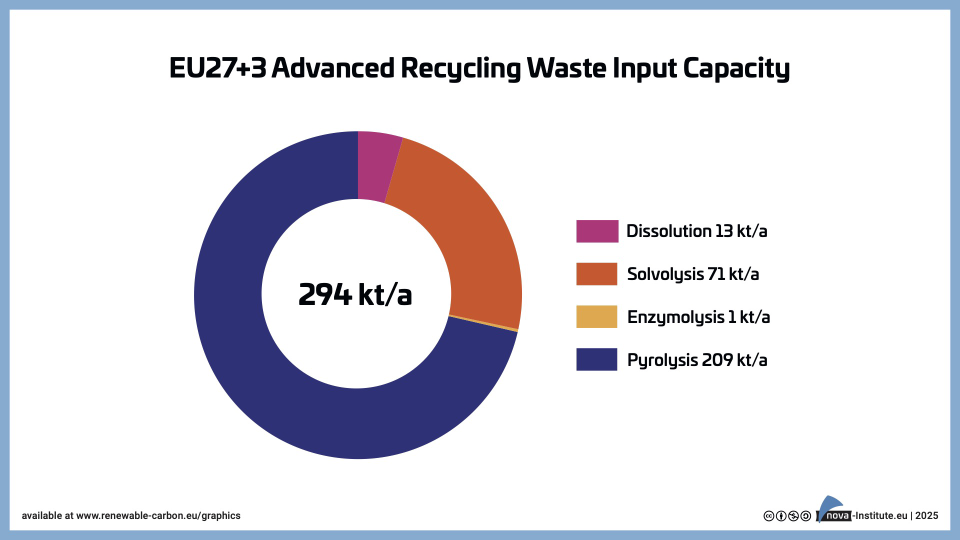
DownloadsInstalled input capacities for different advanced recycling technologies in EU27+3 for the year 2024.
-
18 Downloads
2025-12
FREE
Free Shipping18
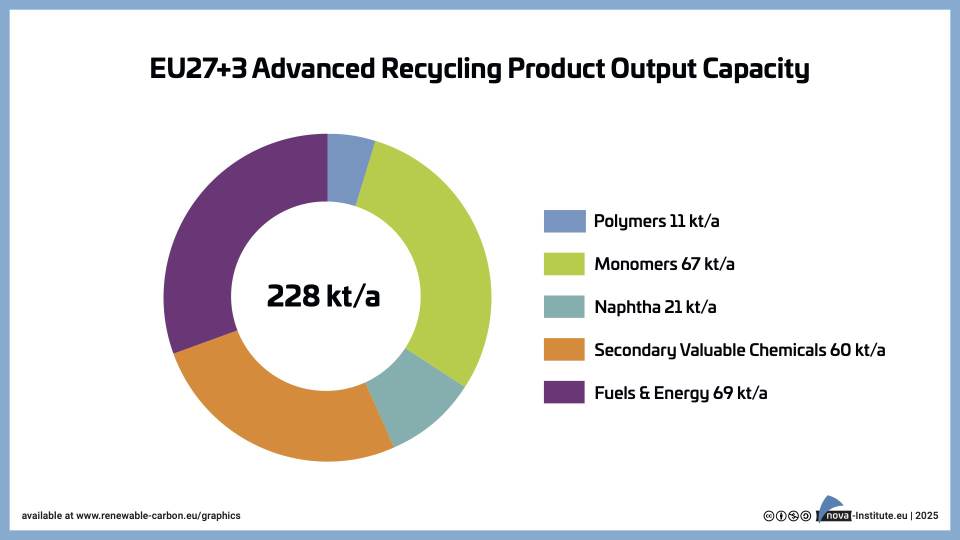
DownloadsInstalled advanced recycling output capacities for different products in EU27+3 for the year 2024.
-
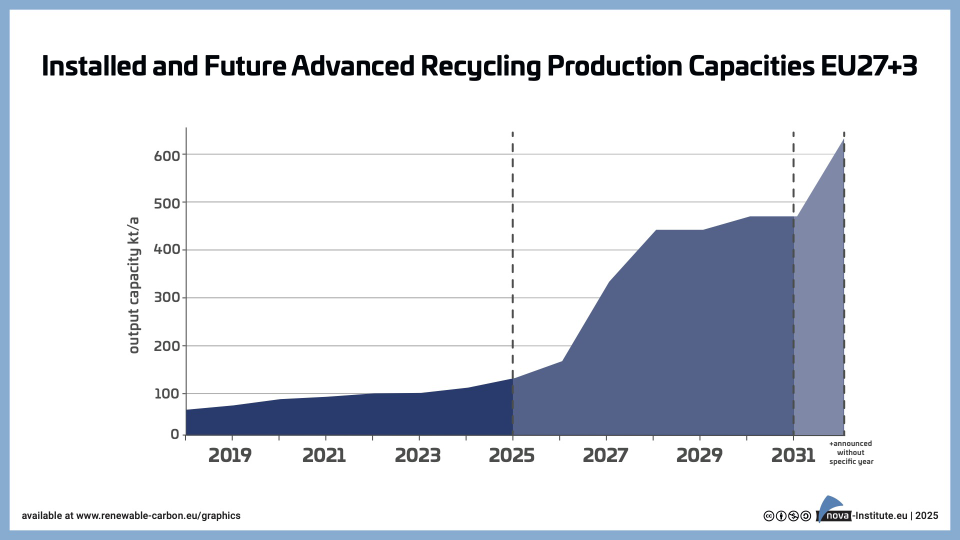
Installed and Future Advanced Recycling Production Capacities between 2018-2031 for EU27+3 (JPG)
Technology
1 Page
32 Downloads 32 Downloads
2025-12
FREE
Free Shipping32
DownloadsInstalled and future production capacities for advanced recycling of products in the EU27+3 that can be used to produce new polymers and plastics.
-
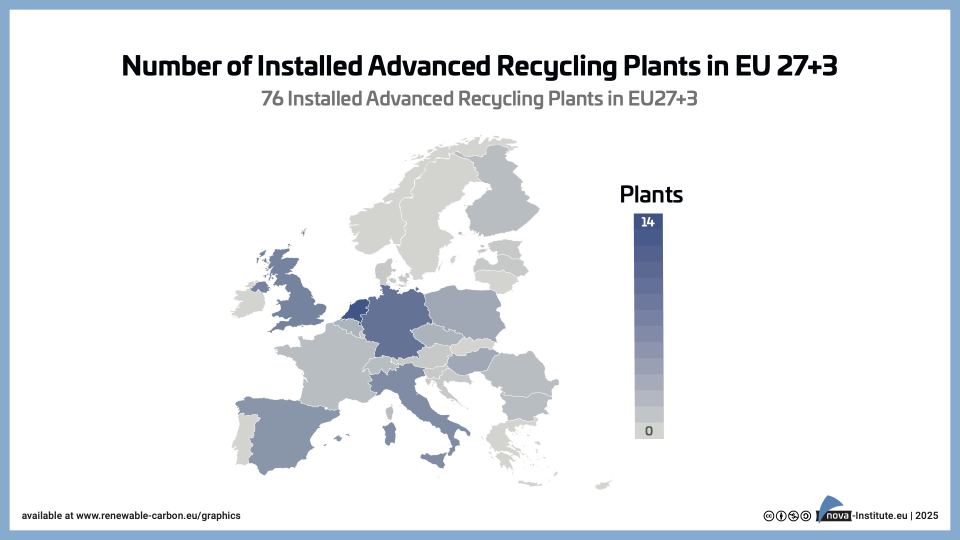
Number of advanced recycling facilities installed in the EU-27+3 in 2024 (JPG)
Technology
1 Page
17 Downloads 17 Downloads
2025-12
FREE
Free Shipping17
DownloadsOverview showing all installed and running advanced recycling plants in the EU27+3 in 2024.
-
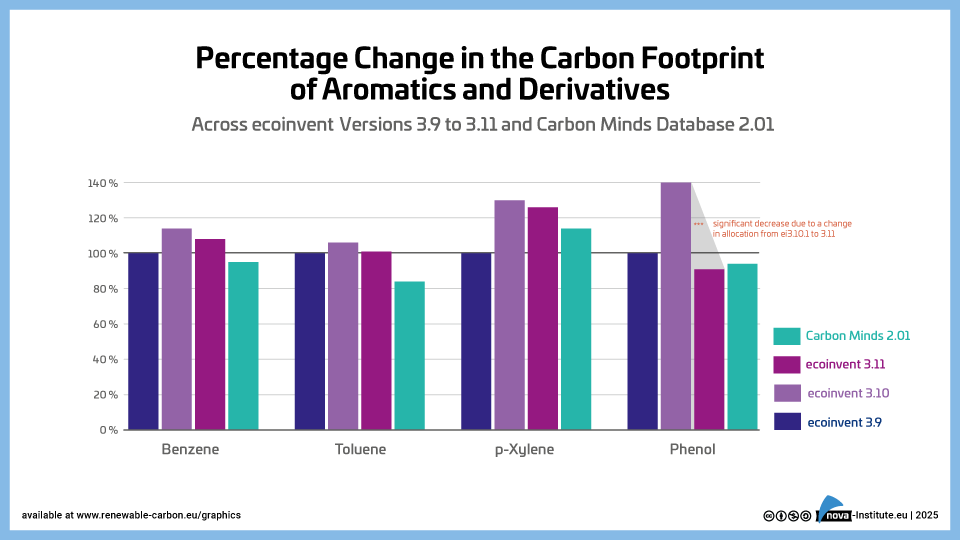
Percentage Change in the Carbon Footprint of Aromatics and Derivatives (PNG)
Sustainability & Health
1 Page
14 Downloads 14 Downloads
2025-10
FREE
Free Shipping14
Downloads -
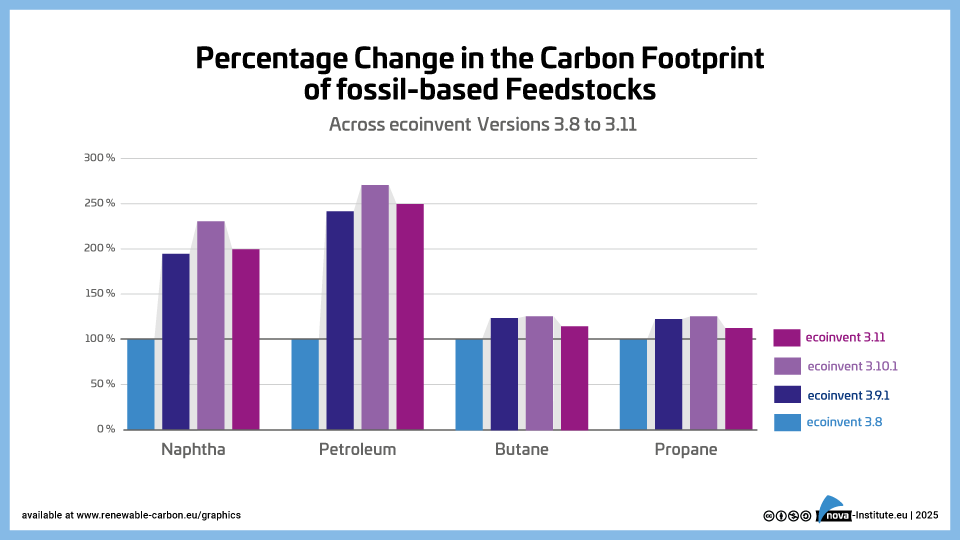
Percentage Change in the Carbon Footprint of fossil-based Feedstocks (PNG)
Sustainability & Health
1 Page
32 Downloads 32 Downloads
2025-10
FREE
Free Shipping32
Downloads -
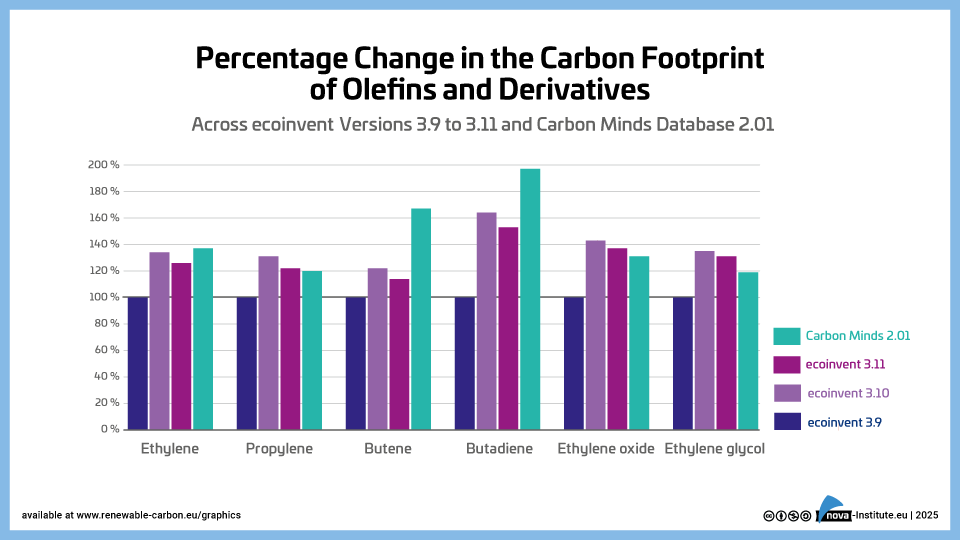
Percentage Change in the Carbon Footprint of Olefins and Derivatives (PNG)
Sustainability & Health
1 Page
14 Downloads 14 Downloads
2025-10
FREE
Free Shipping14
Downloads -
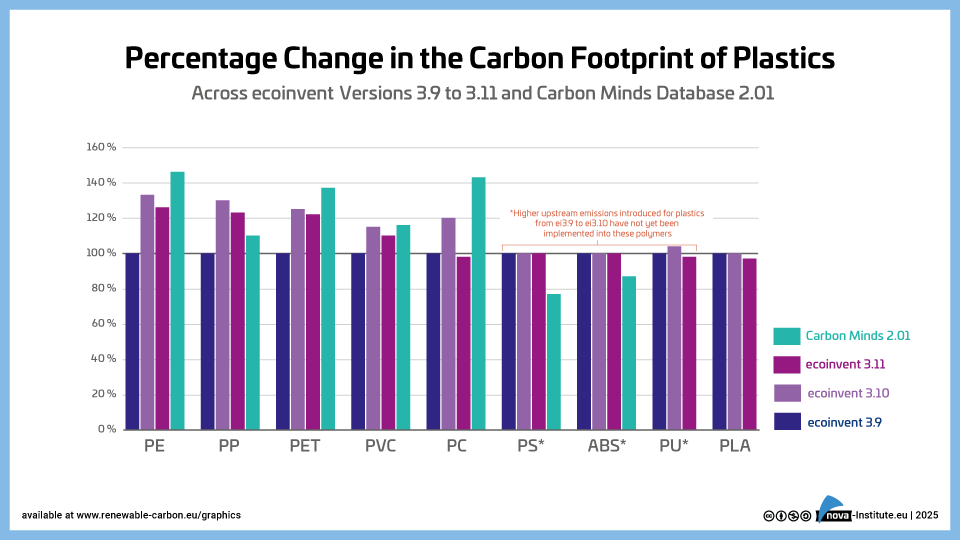
Percentage Change in the Carbon Footprint of Plastics (PNG)
Sustainability & Health
1 Page
44 Downloads 44 Downloads
2025-10
FREE
Free Shipping44
Downloads -
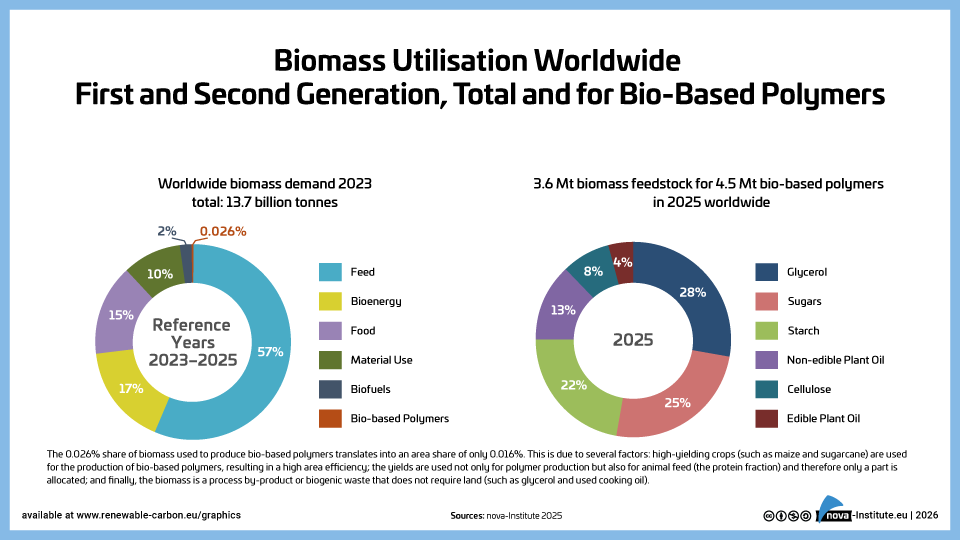
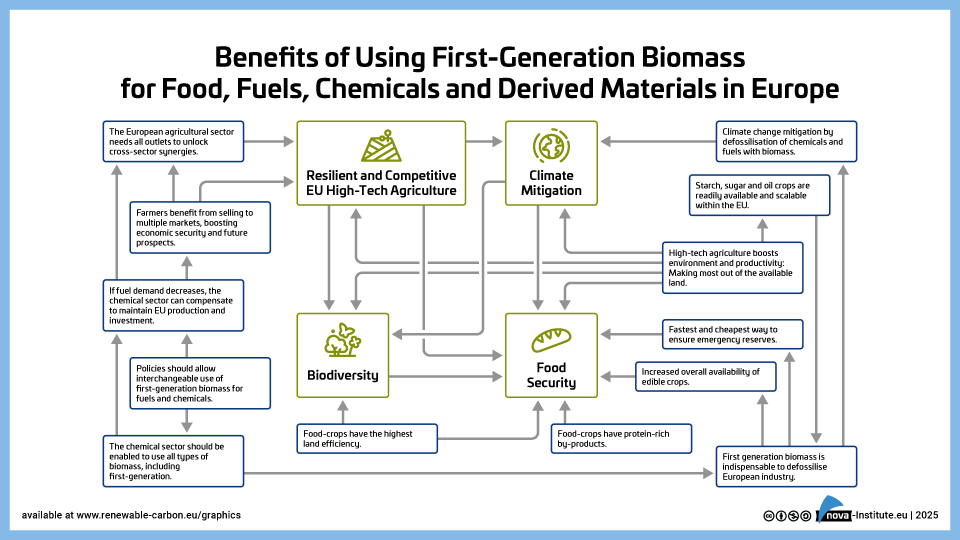
Benefits of Using First-Generation Biomass for Food, Fuel, Materials and Chemicals in Europe (PNG)
Policy, Sustainability & Health
1 Page
116 Downloads 116 Downloads
2025-09
FREE
Free Shipping116
Downloads