Showing 121–140 of 200
-
CO₂ Emissions From Embedded Carbon in Chemicals (PNG)
Sustainability & Health, Technology
1 Page
299 Downloads
299 Downloads
2022-05
FREE
299
DownloadsWhen fossil feedstock is used, the fossil-based embedded carbon contained in chemicals and materials is emitted to the atmosphere at their end of life, assuming complete oxidation (e.g. through combustion or (bio)degradation).
When using CCU-based feedstock to replace the fossil feedstock, at the end of life, no additional carbon (or CO2, respectively) is emitted to the air because it was captured from the air (or from point sources) before through carbon capture. Only the electricity demand for CCU-based feedstock production causes CO2 emissions.
-
Emission Reduction Potential for Replacing Fossil Feedstock with CCU-based Methanol (PNG)
Sustainability & Health, Technology
1 Page
194 Downloads
194 Downloads
2022-05
FREE
194
DownloadsAt end of life, carbon embedded in chemicals and derived materials is released to the atmosphere as CO₂. In the case of fossil-based feedstock, this contributes to global warming. For CCU-based feedstock this is not the case, since all carbon embedded in these products was captured from the air (or from point sources) before through carbon capture. In a simplified model, additional emissions only electricity production for causes emissions for CCU-based feedstock production. Only the use of renewable energy can save emissions.
The GHG emissions of CCU-based methanol could be 67 to 77 % lower compared to emissions from releasing embedded carbon of fossil fuels, when using current energy supply based on photovoltaics. With improvements in renewable energy production, the reduction could increase to levels between 96 and 100 %. -
The Climate Change Mitigation Star: A Sixfold Challenge (PNG)
Policy, Sustainability & Health
1 Page
176 Downloads
176 Downloads
2022-02
FREE
176
DownloadsWhy it is right to choose renewable carbon as a guiding principle for sustainable development in the chemicals and materials sectors.
The Renewable Carbon Initiative (RCI) publishes this fundamental strategy paper on the defossilisation of the chemical and material industry with eleven policy recommendations. The Renewable Carbon Initiative is an interest group of more than 30 well-known companies from the wide field of the chemical and material value chains. (www.renewable-carbon-initiative.com)Read more here: https://renewable-carbon-initiative.com/media/press/?id=315
-
nova Price Indices for Fossil Resources, Metals and Biomass (February 2022) (PNG)
Markets & Economy
1 Page
435 Downloads
435 Downloads
2022-02
FREE
435
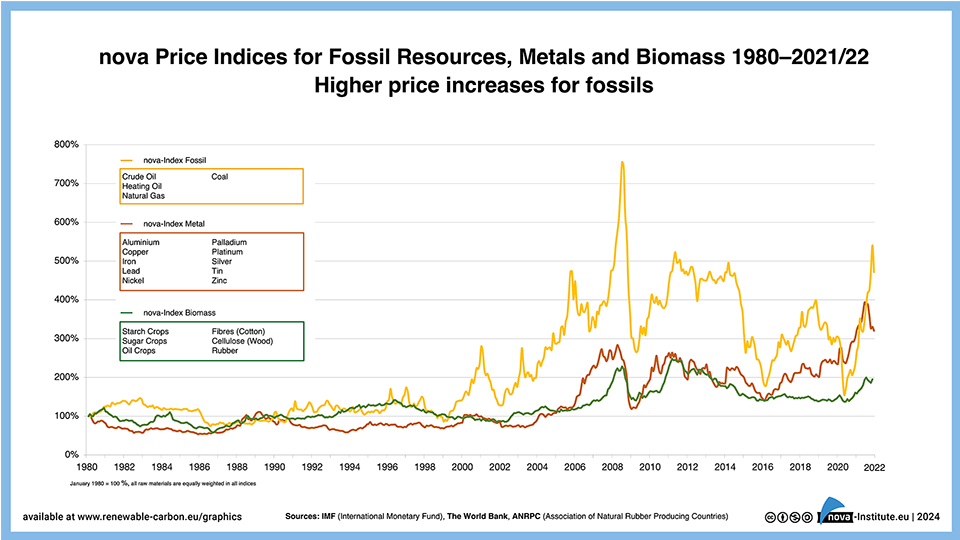
DownloadsSummarised in three price index curves, this chart shows the price development of fossil, biogenic and metallic raw materials since 1980.
More information available at:
https://renewable-carbon.eu/news/higher-price-increases-for-fossils-nova-price-indices-for-fossil-resources-metals-and-biomass-1980-2021 -
Biodegradable Polymers in Various Environments According to Established Standards and Certification Schemes – Graphic (PNG, Version 2021)
Sustainability & Health, Technology
1 Page
1927 Downloads
1927 Downloads
2021-11
FREE
Free Shipping1927
DownloadsNew updated version of the poster on Biodegradable Polymers in Various Environments According to Established Standards and Certification Schemes
The popular poster has been once again updated this autumn to depict to most up-to-date status of commercially available polymers which actually biodegrade in accordance with established standards and certification schemes. An additional partner rounds up this team of leading experts in the area of biodegradable polymers.
-
Biodegradable Polymers in Various Environments According to Established Standards and Certification Schemes – Graphic (PDF, Version 2021)
Sustainability & Health, Technology
1 Page
3322 Downloads
3322 Downloads
2021-11
FREE
3322
DownloadsNew updated version of the poster on Biodegradable Polymers in Various Environments According to Established Standards and Certification Schemes
The popular poster has been once again updated this autumn to depict to most up-to-date status of commercially available polymers which actually biodegrade in accordance with established standards and certification schemes. An additional partner rounds up this team of leading experts in the area of biodegradable polymers.
-
Bioökonomie-Potenziale im Rheinischen Revier – Industriebeschäftige nach Sektor (JPG)
Markets & Economy, Technology
1 Page
49 Downloads
49 Downloads
2021-11
FREE
49
Downloads -
Bioökonomie-Potenziale im Rheinischen Revier – Industrie und Verwertung (JPG)
Markets & Economy, Technology
1 Page
32 Downloads
32 Downloads
2021-11
FREE
32
Downloads -
Bioökonomie-Potenziale im Rheinischen Revier – Relevanteste Industriesektoren (JPG)
Markets & Economy, Technology
1 Page
31 Downloads
31 Downloads
2021-11
FREE
31
Downloads -
281 Downloads
2021-10
FREE
281
Downloads -
Scenario for the Plastic Industry 2050 (PNG)
Markets & Economy, Policy, Sustainability & Health, Technology
1 Page
1542 Downloads
1542 Downloads
2021-10
FREE
1542
DownloadsThe plastics industry of the future will be decoupled from petrochemicals and will meet its carbon needs primarily from recycling. This alone will not close the renewable carbon cycle. The unavoidable losses will then be closed by bio- and CO2-based polymers.
-
Global Carbon Demand for Chemicals and Derived Materials (PNG)
Markets & Economy, Policy, Sustainability & Health, Technology
1 Page
1367 Downloads
1367 Downloads
2021-10
FREE
1367
DownloadsGlobal Carbon Demand for Chemicals and Derived Materials in 2020 and Scenario for 2050 in million of embedded carbon.
-
Comprehensive Concept of a Circular Economy (PNG)
Policy, Sustainability & Health
1 Page
958 Downloads
958 Downloads
2021-08
FREE
958
DownloadsThe graphic shows the value chain from the carbon-containing raw material to the end of the product’s life and all the possible paths to drive all the material flows that arise in the process in a circle. The waste hierarchy also becomes clear.
-
502 Downloads
2021-06
FREE
502
Downloads -
Global Carbon Demand for Chemicals and Materials by Sectors (PDF)
Sustainability & Health
1 Page
544 Downloads
544 Downloads
2021-06
FREE
544
DownloadsThis figure shows the global carbon demand for chemicals and materials by sector. It shows how the chemical sector and its derived materials such as plastics, rubber or synthetic fibres account for over 50% of the world’s embedded carbon. Of this, most of the carbon comes from fossil resources. However, the graph shows that the largest share of embedded carbon in materials comes from biogenic sources at around 50 %.
This is mainly found in fully bio-based sectors such as wood in construction and furniture, pulp and paper, and natural fibres. -
Global Carbon Demand for Chemicals and Materials by Sectors (PNG)
Sustainability & Health
1 Page
362 Downloads
362 Downloads
2021-06
FREE
362
DownloadsThis figure shows the global carbon demand for chemicals and materials by sector. It shows how the chemical sector and its derived materials such as plastics, rubber or synthetic fibres account for over 50% of the world’s embedded carbon. Of this, most of the carbon comes from fossil resources. However, the graph shows that the largest share of embedded carbon in materials comes from biogenic sources at around 50 %.
This is mainly found in fully bio-based sectors such as wood in construction and furniture, pulp and paper, and natural fibres. -
Embedded Carbon Demand for Main Sector – Today and 2050 (PNG)
Sustainability & Health
1 Page
204 Downloads
204 Downloads
2021-06
FREE
204
DownloadsThis graph shows how the global carbon demand for the most important sectors could develop by 2050. On the one hand, it shows the steadily growing demand for carbon in the chemical and materials sectors and, on the other hand, the declining demand in the energy and transport sectors, driven by ongoing decarbonisation.
-
Embedded Carbon Demand for Main Sector – Today and 2050 (PDF)
Sustainability & Health
1 Page
246 Downloads
246 Downloads
2021-06
FREE
246
DownloadsThis graph shows how the global carbon demand for the most important sectors could develop by 2050. On the one hand, it shows the steadily growing demand for carbon in the chemical and materials sectors and, on the other hand, the declining demand in the energy and transport sectors, driven by ongoing decarbonisation.
-
BioSinn Produkte / Anwendungen – Übersicht der Marktvolumina in Deutschland (PNG)
Markets & Economy
1 Page
190 Downloads
190 Downloads
2021-05
FREE
190
DownloadsIm BioSinn Projekt hat das nova-Institut die Marktvolumina für 25 Produkte und Anwendungen zusammengetragen und die Verlustmenge in die Natur geschätzt.
-
287 Downloads
2021-05
FREE
287
Downloads


