Showing 1–20 of 534
-
ZOOM-Interview with Alex Hogan (CEO of Vioneo) by Michael Carus (nova-Institut/RCI), 11 May 2026 (PDF)
Markets & Economy, Policy
3 Pages
34 Downloads
34 Downloads
2026-05
FREE
Free Shipping34
DownloadsThe vision of Vioneo as ‘fossil-free pioneers for the plastics industry, using green methanol to produce fossil-free polypropylene and polyethylene on a commercial scale‘ will be realised in China, not in Europe. Michael asks Alex why this is the case.
Mandatory EU legislation (quotas, definitions, regulatory differentiation) is the single most important enabler for Vioneo — and similar companies — to invest in Europe. Without it, the market remains voluntary, price-driven, and commercially unviable for premium fossil-free products.
As Europe is a more expensive production location than the US or Asia, the only way forward – as Alex Hogan makes clear – is to create clear, strong and lasting framework conditions in Europe to generate robust demand for renewable chemistry and plastics, as well as to build the infrastructure that makes production in the EU possible. These framework conditions are indeed being discussed and are planned, but it is not certain whether they will actually materialise, in what form, or when. But who invests in hopes and announcements?
-
Could the production of European chemicals be achieved without naphtha and steam crackers? What alternative pathways could be viable in the future? (PDF)
Markets & Economy, Policy, Technology
7 Pages
98 Downloads 98 Downloads
2026-05
FREE
Free Shipping98
DownloadsOver the next few decades, naphtha steam cracking will remain the dominant and most efficient process in the European chemical industry. However, naphtha is produced from crude oil, which is linked to several problems: (1) climate change, especially from Scope 3 emissions; (2) a linear instead of a circular economy; (3) most innovation taking place in other areas than crackers; (4) a failure to achieve resilience and strategic autonomy; and (5) Europe’s inability to compete with other regions of the world that have better access to cheaper crude oil and naphtha. Furthermore, (6) renewable naphtha produced from biomass, waste or CO₂ is very expensive (2–3 times more expensive), and (7) other pathways than naphtha and steam crackers are often more efficient for these alternative renewable feedstocks.
These are seven good reasons to discuss what alternative pathways could be viable in the future of Europe’s chemical industry and how they could be implemented. This paper mainly focuses on methanol, ethanol and biodiesel. Before delving into these topics, two brief comments on ammonia production, biotechnology and biomanufacturing and electrochemistry are provided.
-
Investments totalling more than 5 billion with a future bio-based quota for plastics in Europe (PDF)
Markets & Economy, Policy
3 Pages
57 Downloads 57 Downloads
2026-05
FREE
Free Shipping57
DownloadsImplementing a 5% bio-based quota for all polymers produced in Europe could be just as successful as the introduction of biofuels.
As a draft scenario, we assume that (1) 30% will come from bio-attributed sources, (2) 25% from dedicated bio-based polymers, and (3) 45% from drop-in bio-based polymers. What would this require in terms of investment? Based on these assumptions, a 5% bio-based (including bio-attributed) polymer quota would generate €5.3 billion in investment, similar to the level of investment in first-generation biofuels. A subsequent 30% bio-based (including bio-attributed) polymer quota would generate €32 billion, similar to the level of investment in sustainable aviation fuels (SAF) in the next decades.
-
CO2-based Fuels and Chemicals Conference 2026 (Proceedings, PDF)
Markets & Economy, Policy, Sustainability & Health, Technology
2026-05
150 € ex. tax
Plus 19% MwSt.Press
release Add to
cartThe proceedings of the CO2-based Fuels and Chemicals Conference 2026 (28-29 April 2026, https://co2-chemistry.eu) contain all released presentations (download of the program leaflet, PDF) and the press release of the three winners of the Innovation Award “Best CO2 Utilisation 2026″.
-
Support for bio-based feedstock in plastic packaging analysis under the Packaging and Packaging Waste Regulation (EU) 2025/40 (Affiliate product)
Markets & Economy, Policy, Sustainability & Health, Technology
100 Pages
2026-05
FREE
Free Shipping0
More
Downloads
infoNew publication from nova experts for the European Commission
This report assesses the role of bio-based feedstocks in plastic packaging under the EU’s Packaging and Packaging Waste Regulation (PPWR), with a focus on technological development and environmental performance. Although seventeen bio-based polymers are commercially available, they represent only ~1% of the global plastics market and account for just 4–5% of biogenic carbon in the EU chemical sector. Production capacity is concentrated in Asia (55%), followed by North America (17%) and the EU27+3 (14%). Despite their limited market share, there are no fundamental technical barriers to using them in packaging. Bio-based plastics offer a 30–70% reduction in greenhouse gas emissions compared to fossil-based alternatives, which supports the EU’s decarbonisation and circular economy goals. The report also evaluates the feasibility of setting targets for the use of bio-based materials, their equivalence with recycled materials and how sustainability criteria can be aligned with the Renewable Energy Directive (RED). Key recommendations include setting binding targets for bio-based content, establishing harmonised sustainability criteria, and adapting recycling infrastructure. Leveraging the complementarity of bio -based and recycled content could help to accelerate the EU’s transition to a climate-neutral packaging sector.Direct download via the renewable-carbon.eu/publications is not possible. -
AI Circular Economy Conference 2026 (Proceedings, PDF)
Markets & Economy, Policy, Sustainability & Health, Technology
2026-03
150 € ex. tax
Plus 19% MwSt.Press
release Add to
cartThe proceedings of the AI Circular Economy Conference 2026 (4-5 March, https://ai-circulareconomy.eu ) contain 25 conference presentations and the press release. Download of the program leaflet.
-
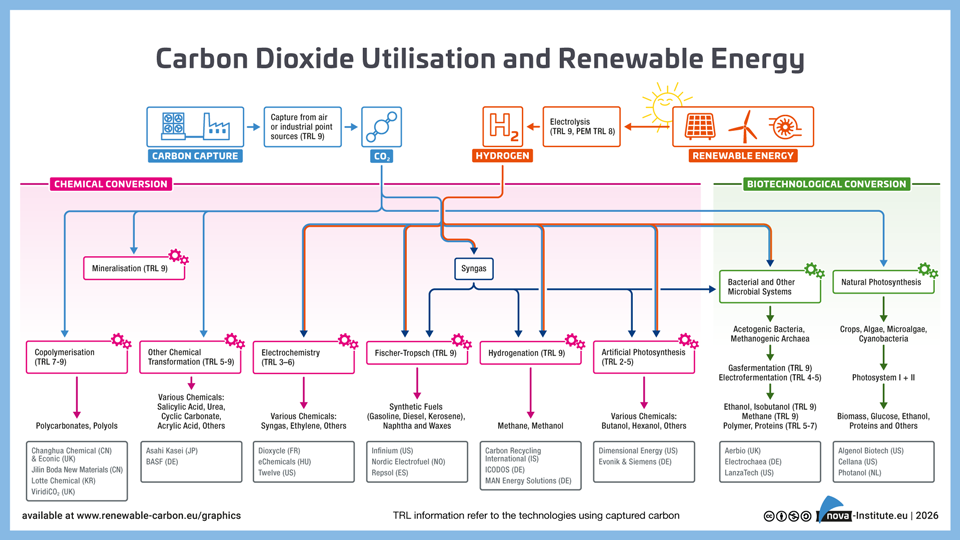
Carbon Dioxide Utilisation and Renewable Energy − Graphic (PNG)
Markets & Economy, Technology
1 Page
86 Downloads 86 Downloads
2026-02
FREE
Free Shipping86
Downloads -
84 Downloads
2026-02
FREE
Free Shipping84
DownloadsThe new high-level report “Bio‑based Building Blocks and Polymers – Global Capacities, Production and Trends 2025–2030”, compiled by the international biopolymer expert group of the nova-Institute, provides an overview of the capacities and production data of 17 commercially available bio‑based building blocks and polymers in 2025, along with a forecast for 2030. Detailed market data is available via individual workshops and webinars with the biopolymer experts. This data includes capacity development from 2018 to 2030, production data for the years 2024 and 2025, and analyses of market developments per building block, polymer and producers, as well as a statistical analysis of “Mass Balance and Attribution (MBA)” products available worldwide.
2025 was a solid year for bio-based polymers, with an expected overall CAGR of 11 % to 2030 and an average capacity utilisation rate of 86 %. Overall, bio-based non-biodegradable polymers have larger installed capacities and higher utilisation rates than bio-based biodegradable polymers. While 58 % of the total installed capacities are from bio-based non-biodegradable polymers, 42 % are bio-based biodegradable polymers. Bio-based non-biodegradable have an average utilisation rate of 90 % whereas bio-based biodegradable polymers have an average utilisation rate of 81 %. The expected CAGR for both, bio-based non-biodegradable and biodegradable is similar with 10 % and 11 %, respectively.
Epoxy resin and PUR production is growing moderately at 9 and 8 %, respectively, while PE and PP are increasing by 17 % and 94 %. Also, capacities for the biodegradables PHA and PLA are expected to increase until 2030 by 49 % and 16 %, respectively. Commercial newcomers such as casein polymers and PEF have increased production capacity and are expected to continue to grow significantly until 2030.
DOI No.: https://doi.org/10.52548/PILO4285
-
296 Downloads
2026-02
FREE
Free Shipping296
DownloadsBased on internal assessment of RCI member companies and joint analysis, this report reveals existing EU legislation which creates several roadblocks for the shift from fossil to renewable carbon, The report identifies ten concrete policy barriers across seven EU frameworks, including the ETS, REDIII, PPWR and SUPD.
Key findings show regulatory misalignment (creating non-level playing fields and regulatory uncertainty), outdated definitions and misleading classifications (excluding innovative, climate-friendly products from incentives and market access) and impractical administrative bureaucracy (often conflicting with industrial realities). The biggest barrier is not identified in a single regulation, but identified as the lack of coherent support for renewable carbon in the chemicals and derived materials economy.
The report provides practical suggestions to amend and fine-tune regulations in upcoming legislative revisions. It complements RCI’s policy proposal study published in 2025.
-
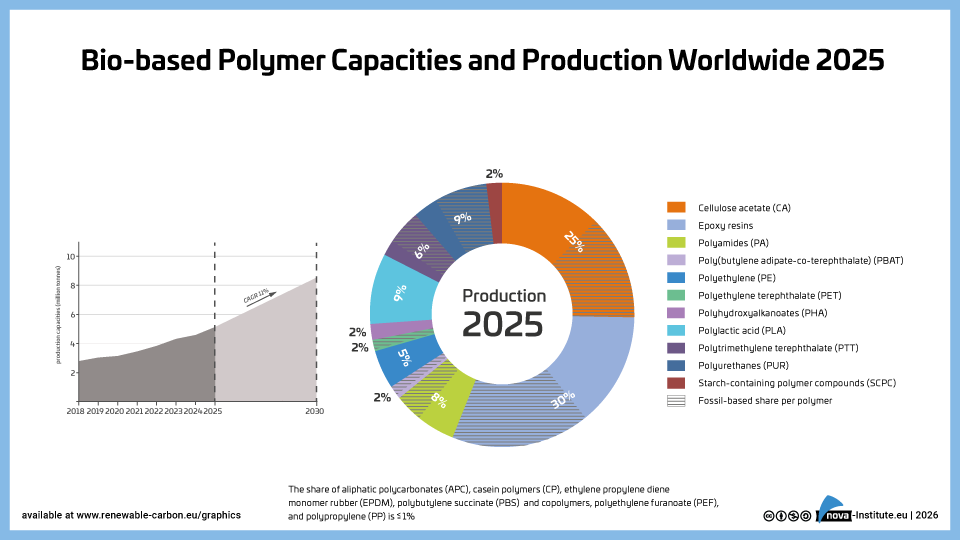
Bio-based Polymer Capacities and Production Worldwide 2025 (PNG)
Markets & Economy
1 Page
49 Downloads 49 Downloads
2026-02
FREE
Free Shipping49
DownloadsThe new high-level report “Bio‑based Building Blocks and Polymers – Global Capacities, Production and Trends 2025–2030”, compiled by the international biopolymer expert group of the nova-Institute, provides an overview of the capacities and production data of 17 commercially available bio‑based building blocks and polymers in 2025, along with a forecast for 2030. Detailed market data is available via individual workshops and webinars with the biopolymer experts. This data includes capacity development from 2018 to 2030, production data for the years 2024 and 2025, and analyses of market developments per building block, polymer and producers, as well as a statistical analysis of “Mass Balance and Attribution (MBA)” products available worldwide.
2025 was a solid year for bio-based polymers, with an expected overall CAGR of 11 % to 2030 and an average capacity utilisation rate of 86 %. Overall, bio-based non-biodegradable polymers have larger installed capacities and higher utilisation rates than bio-based biodegradable polymers. While 58 % of the total installed capacities are from bio-based non-biodegradable polymers, 42 % are bio-based biodegradable polymers. Bio-based non-biodegradable have an average utilisation rate of 90 % whereas bio-based biodegradable polymers have an average utilisation rate of 81 %. The expected CAGR for both, bio-based non-biodegradable and biodegradable is similar with 10 % and 11 %, respectively.
Epoxy resin and PUR production is growing moderately at 9 and 8 %, respectively, while PE and PP are increasing by 17 % and 94 %. Also, capacities for the biodegradables PHA and PLA are expected to increase until 2030 by 49 % and 16 %, respectively. Commercial newcomers such as casein polymers and PEF have increased production capacity and are expected to continue to grow significantly until 2030.
DOI No.: https://doi.org/10.52548/PILO4285
-
51 Downloads
2026-02
FREE
Free Shipping51
DownloadsThe new high-level report “Bio‑based Building Blocks and Polymers – Global Capacities, Production and Trends 2025–2030”, compiled by the international biopolymer expert group of the nova-Institute, provides an overview of the capacities and production data of 17 commercially available bio‑based building blocks and polymers in 2025, along with a forecast for 2030. Detailed market data is available via individual workshops and webinars with the biopolymer experts. This data includes capacity development from 2018 to 2030, production data for the years 2024 and 2025, and analyses of market developments per building block, polymer and producers, as well as a statistical analysis of “Mass Balance and Attribution (MBA)” products available worldwide.
2025 was a solid year for bio-based polymers, with an expected overall CAGR of 11 % to 2030 and an average capacity utilisation rate of 86 %. Overall, bio-based non-biodegradable polymers have larger installed capacities and higher utilisation rates than bio-based biodegradable polymers. While 58 % of the total installed capacities are from bio-based non-biodegradable polymers, 42 % are bio-based biodegradable polymers. Bio-based non-biodegradable have an average utilisation rate of 90 % whereas bio-based biodegradable polymers have an average utilisation rate of 81 %. The expected CAGR for both, bio-based non-biodegradable and biodegradable is similar with 10 % and 11 %, respectively.
Epoxy resin and PUR production is growing moderately at 9 and 8 %, respectively, while PE and PP are increasing by 17 % and 94 %. Also, capacities for the biodegradables PHA and PLA are expected to increase until 2030 by 49 % and 16 %, respectively. Commercial newcomers such as casein polymers and PEF have increased production capacity and are expected to continue to grow significantly until 2030.
DOI No.: https://doi.org/10.52548/PILO4285
-
61 Downloads
2026-02
FREE
Free Shipping61
DownloadsThe new high-level report “Bio‑based Building Blocks and Polymers – Global Capacities, Production and Trends 2025–2030”, compiled by the international biopolymer expert group of the nova-Institute, provides an overview of the capacities and production data of 17 commercially available bio‑based building blocks and polymers in 2025, along with a forecast for 2030. Detailed market data is available via individual workshops and webinars with the biopolymer experts. This data includes capacity development from 2018 to 2030, production data for the years 2024 and 2025, and analyses of market developments per building block, polymer and producers, as well as a statistical analysis of “Mass Balance and Attribution (MBA)” products available worldwide.
2025 was a solid year for bio-based polymers, with an expected overall CAGR of 11 % to 2030 and an average capacity utilisation rate of 86 %. Overall, bio-based non-biodegradable polymers have larger installed capacities and higher utilisation rates than bio-based biodegradable polymers. While 58 % of the total installed capacities are from bio-based non-biodegradable polymers, 42 % are bio-based biodegradable polymers. Bio-based non-biodegradable have an average utilisation rate of 90 % whereas bio-based biodegradable polymers have an average utilisation rate of 81 %. The expected CAGR for both, bio-based non-biodegradable and biodegradable is similar with 10 % and 11 %, respectively.
Epoxy resin and PUR production is growing moderately at 9 and 8 %, respectively, while PE and PP are increasing by 17 % and 94 %. Also, capacities for the biodegradables PHA and PLA are expected to increase until 2030 by 49 % and 16 %, respectively. Commercial newcomers such as casein polymers and PEF have increased production capacity and are expected to continue to grow significantly until 2030.
DOI No.: https://doi.org/10.52548/PILO4285
-
47 Downloads
2026-02
FREE
Free Shipping47
DownloadsThe new high-level report “Bio‑based Building Blocks and Polymers – Global Capacities, Production and Trends 2025–2030”, compiled by the international biopolymer expert group of the nova-Institute, provides an overview of the capacities and production data of 17 commercially available bio‑based building blocks and polymers in 2025, along with a forecast for 2030. Detailed market data is available via individual workshops and webinars with the biopolymer experts. This data includes capacity development from 2018 to 2030, production data for the years 2024 and 2025, and analyses of market developments per building block, polymer and producers, as well as a statistical analysis of “Mass Balance and Attribution (MBA)” products available worldwide.
2025 was a solid year for bio-based polymers, with an expected overall CAGR of 11 % to 2030 and an average capacity utilisation rate of 86 %. Overall, bio-based non-biodegradable polymers have larger installed capacities and higher utilisation rates than bio-based biodegradable polymers. While 58 % of the total installed capacities are from bio-based non-biodegradable polymers, 42 % are bio-based biodegradable polymers. Bio-based non-biodegradable have an average utilisation rate of 90 % whereas bio-based biodegradable polymers have an average utilisation rate of 81 %. The expected CAGR for both, bio-based non-biodegradable and biodegradable is similar with 10 % and 11 %, respectively.
Epoxy resin and PUR production is growing moderately at 9 and 8 %, respectively, while PE and PP are increasing by 17 % and 94 %. Also, capacities for the biodegradables PHA and PLA are expected to increase until 2030 by 49 % and 16 %, respectively. Commercial newcomers such as casein polymers and PEF have increased production capacity and are expected to continue to grow significantly until 2030.
DOI No.: https://doi.org/10.52548/PILO4285
-
Bio-based polymers – Evolution of worldwide production capacities from 2018 to 2030 (PNG)
Markets & Economy
1 Page
55 Downloads 55 Downloads
2026-02
FREE
Free Shipping55
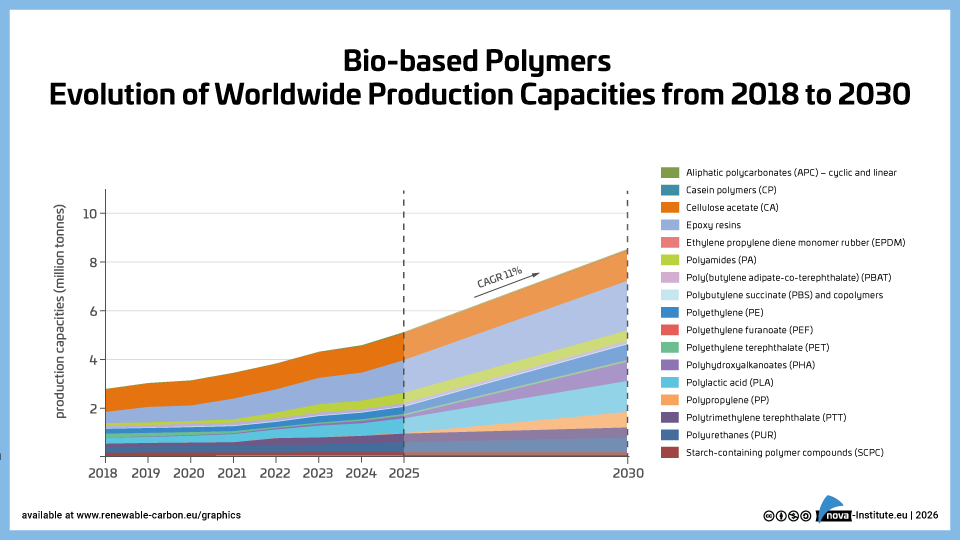
DownloadsThe new high-level report “Bio‑based Building Blocks and Polymers – Global Capacities, Production and Trends 2025–2030”, compiled by the international biopolymer expert group of the nova-Institute, provides an overview of the capacities and production data of 17 commercially available bio‑based building blocks and polymers in 2025, along with a forecast for 2030. Detailed market data is available via individual workshops and webinars with the biopolymer experts. This data includes capacity development from 2018 to 2030, production data for the years 2024 and 2025, and analyses of market developments per building block, polymer and producers, as well as a statistical analysis of “Mass Balance and Attribution (MBA)” products available worldwide.
2025 was a solid year for bio-based polymers, with an expected overall CAGR of 11 % to 2030 and an average capacity utilisation rate of 86 %. Overall, bio-based non-biodegradable polymers have larger installed capacities and higher utilisation rates than bio-based biodegradable polymers. While 58 % of the total installed capacities are from bio-based non-biodegradable polymers, 42 % are bio-based biodegradable polymers. Bio-based non-biodegradable have an average utilisation rate of 90 % whereas bio-based biodegradable polymers have an average utilisation rate of 81 %. The expected CAGR for both, bio-based non-biodegradable and biodegradable is similar with 10 % and 11 %, respectively.
Epoxy resin and PUR production is growing moderately at 9 and 8 %, respectively, while PE and PP are increasing by 17 % and 94 %. Also, capacities for the biodegradables PHA and PLA are expected to increase until 2030 by 49 % and 16 %, respectively. Commercial newcomers such as casein polymers and PEF have increased production capacity and are expected to continue to grow significantly until 2030.
DOI No.: https://doi.org/10.52548/PILO4285
-
Global Production Capacities of Bio-based Polymers per region 2025 (PNG)
Markets & Economy
1 Page
37 Downloads 37 Downloads
2026-02
FREE
Free Shipping37
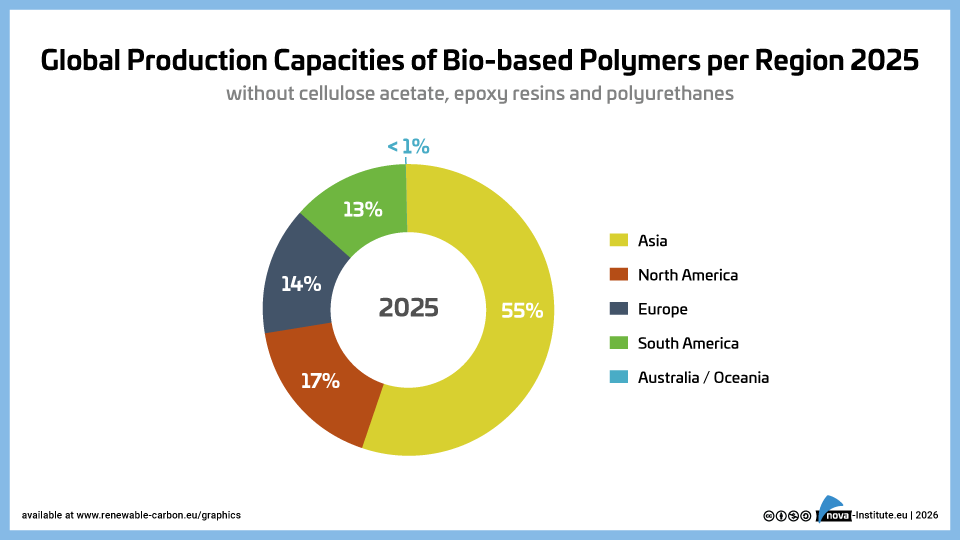
DownloadsThe new high-level report “Bio‑based Building Blocks and Polymers – Global Capacities, Production and Trends 2025–2030”, compiled by the international biopolymer expert group of the nova-Institute, provides an overview of the capacities and production data of 17 commercially available bio‑based building blocks and polymers in 2025, along with a forecast for 2030. Detailed market data is available via individual workshops and webinars with the biopolymer experts. This data includes capacity development from 2018 to 2030, production data for the years 2024 and 2025, and analyses of market developments per building block, polymer and producers, as well as a statistical analysis of “Mass Balance and Attribution (MBA)” products available worldwide.
2025 was a solid year for bio-based polymers, with an expected overall CAGR of 11 % to 2030 and an average capacity utilisation rate of 86 %. Overall, bio-based non-biodegradable polymers have larger installed capacities and higher utilisation rates than bio-based biodegradable polymers. While 58 % of the total installed capacities are from bio-based non-biodegradable polymers, 42 % are bio-based biodegradable polymers. Bio-based non-biodegradable have an average utilisation rate of 90 % whereas bio-based biodegradable polymers have an average utilisation rate of 81 %. The expected CAGR for both, bio-based non-biodegradable and biodegradable is similar with 10 % and 11 %, respectively.
Epoxy resin and PUR production is growing moderately at 9 and 8 %, respectively, while PE and PP are increasing by 17 % and 94 %. Also, capacities for the biodegradables PHA and PLA are expected to increase until 2030 by 49 % and 16 %, respectively. Commercial newcomers such as casein polymers and PEF have increased production capacity and are expected to continue to grow significantly until 2030.
DOI No.: https://doi.org/10.52548/PILO4285
-
Bio-based non biodegradable polymers Evolution of Capacities (PNG)
Markets & Economy
1 Page
25 Downloads 25 Downloads
2026-02
FREE
Free Shipping25
DownloadsThe new high-level report “Bio‑based Building Blocks and Polymers – Global Capacities, Production and Trends 2025–2030”, compiled by the international biopolymer expert group of the nova-Institute, provides an overview of the capacities and production data of 17 commercially available bio‑based building blocks and polymers in 2025, along with a forecast for 2030. Detailed market data is available via individual workshops and webinars with the biopolymer experts. This data includes capacity development from 2018 to 2030, production data for the years 2024 and 2025, and analyses of market developments per building block, polymer and producers, as well as a statistical analysis of “Mass Balance and Attribution (MBA)” products available worldwide.
2025 was a solid year for bio-based polymers, with an expected overall CAGR of 11 % to 2030 and an average capacity utilisation rate of 86 %. Overall, bio-based non-biodegradable polymers have larger installed capacities and higher utilisation rates than bio-based biodegradable polymers. While 58 % of the total installed capacities are from bio-based non-biodegradable polymers, 42 % are bio-based biodegradable polymers. Bio-based non-biodegradable have an average utilisation rate of 90 % whereas bio-based biodegradable polymers have an average utilisation rate of 81 %. The expected CAGR for both, bio-based non-biodegradable and biodegradable is similar with 10 % and 11 %, respectively.
Epoxy resin and PUR production is growing moderately at 9 and 8 %, respectively, while PE and PP are increasing by 17 % and 94 %. Also, capacities for the biodegradables PHA and PLA are expected to increase until 2030 by 49 % and 16 %, respectively. Commercial newcomers such as casein polymers and PEF have increased production capacity and are expected to continue to grow significantly until 2030.
DOI No.: https://doi.org/10.52548/PILO4285
-
Bio-based biodegradable polymers-Evolution Capacities to 2030 (PNG)
Markets & Economy
1 Page
42 Downloads 42 Downloads
2026-02
FREE
Free Shipping42
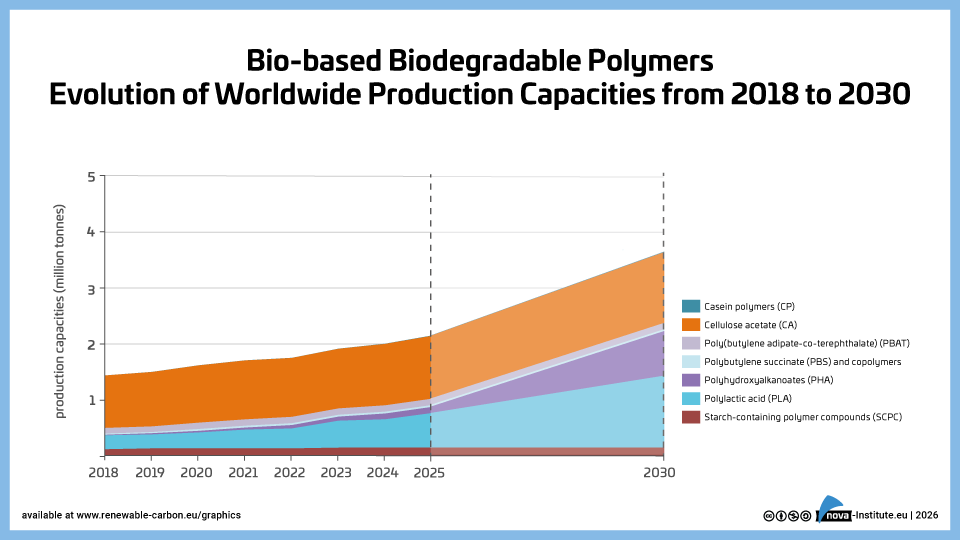
DownloadsThe new high-level report “Bio‑based Building Blocks and Polymers – Global Capacities, Production and Trends 2025–2030”, compiled by the international biopolymer expert group of the nova-Institute, provides an overview of the capacities and production data of 17 commercially available bio‑based building blocks and polymers in 2025, along with a forecast for 2030. Detailed market data is available via individual workshops and webinars with the biopolymer experts. This data includes capacity development from 2018 to 2030, production data for the years 2024 and 2025, and analyses of market developments per building block, polymer and producers, as well as a statistical analysis of “Mass Balance and Attribution (MBA)” products available worldwide.
2025 was a solid year for bio-based polymers, with an expected overall CAGR of 11 % to 2030 and an average capacity utilisation rate of 86 %. Overall, bio-based non-biodegradable polymers have larger installed capacities and higher utilisation rates than bio-based biodegradable polymers. While 58 % of the total installed capacities are from bio-based non-biodegradable polymers, 42 % are bio-based biodegradable polymers. Bio-based non-biodegradable have an average utilisation rate of 90 % whereas bio-based biodegradable polymers have an average utilisation rate of 81 %. The expected CAGR for both, bio-based non-biodegradable and biodegradable is similar with 10 % and 11 %, respectively.
Epoxy resin and PUR production is growing moderately at 9 and 8 %, respectively, while PE and PP are increasing by 17 % and 94 %. Also, capacities for the biodegradables PHA and PLA are expected to increase until 2030 by 49 % and 16 %, respectively. Commercial newcomers such as casein polymers and PEF have increased production capacity and are expected to continue to grow significantly until 2030.
DOI No.: https://doi.org/10.52548/PILO4285
-
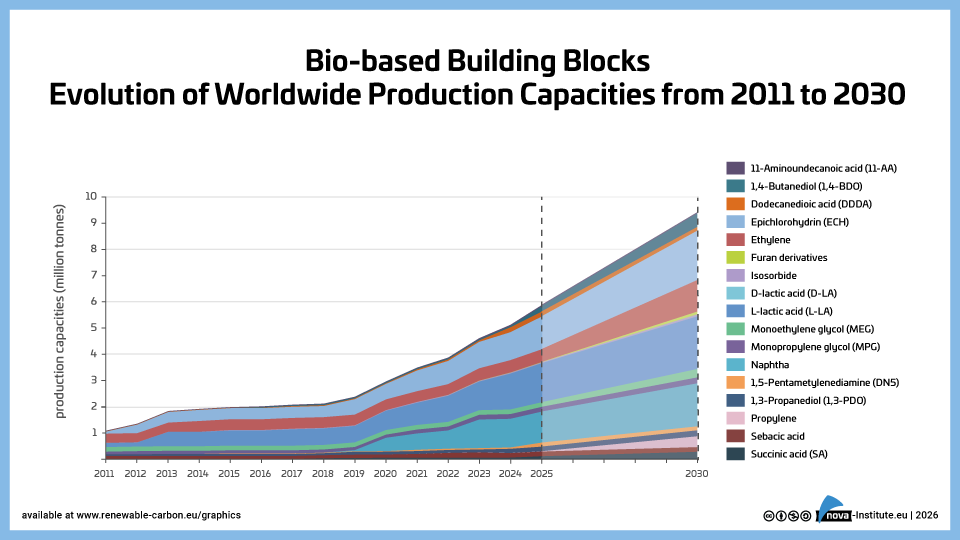
Bio-based building blocks – Evolution of capacities to 2030 (PNG)
Markets & Economy
1 Page
30 Downloads 30 Downloads
2026-02
FREE
Free Shipping30
DownloadsThe new high-level report “Bio‑based Building Blocks and Polymers – Global Capacities, Production and Trends 2025–2030”, compiled by the international biopolymer expert group of the nova-Institute, provides an overview of the capacities and production data of 17 commercially available bio‑based building blocks and polymers in 2025, along with a forecast for 2030. Detailed market data is available via individual workshops and webinars with the biopolymer experts. This data includes capacity development from 2018 to 2030, production data for the years 2024 and 2025, and analyses of market developments per building block, polymer and producers, as well as a statistical analysis of “Mass Balance and Attribution (MBA)” products available worldwide.
2025 was a solid year for bio-based polymers, with an expected overall CAGR of 11 % to 2030 and an average capacity utilisation rate of 86 %. Overall, bio-based non-biodegradable polymers have larger installed capacities and higher utilisation rates than bio-based biodegradable polymers. While 58 % of the total installed capacities are from bio-based non-biodegradable polymers, 42 % are bio-based biodegradable polymers. Bio-based non-biodegradable have an average utilisation rate of 90 % whereas bio-based biodegradable polymers have an average utilisation rate of 81 %. The expected CAGR for both, bio-based non-biodegradable and biodegradable is similar with 10 % and 11 %, respectively.
Epoxy resin and PUR production is growing moderately at 9 and 8 %, respectively, while PE and PP are increasing by 17 % and 94 %. Also, capacities for the biodegradables PHA and PLA are expected to increase until 2030 by 49 % and 16 %, respectively. Commercial newcomers such as casein polymers and PEF have increased production capacity and are expected to continue to grow significantly until 2030.
DOI No.: https://doi.org/10.52548/PILO4285
-
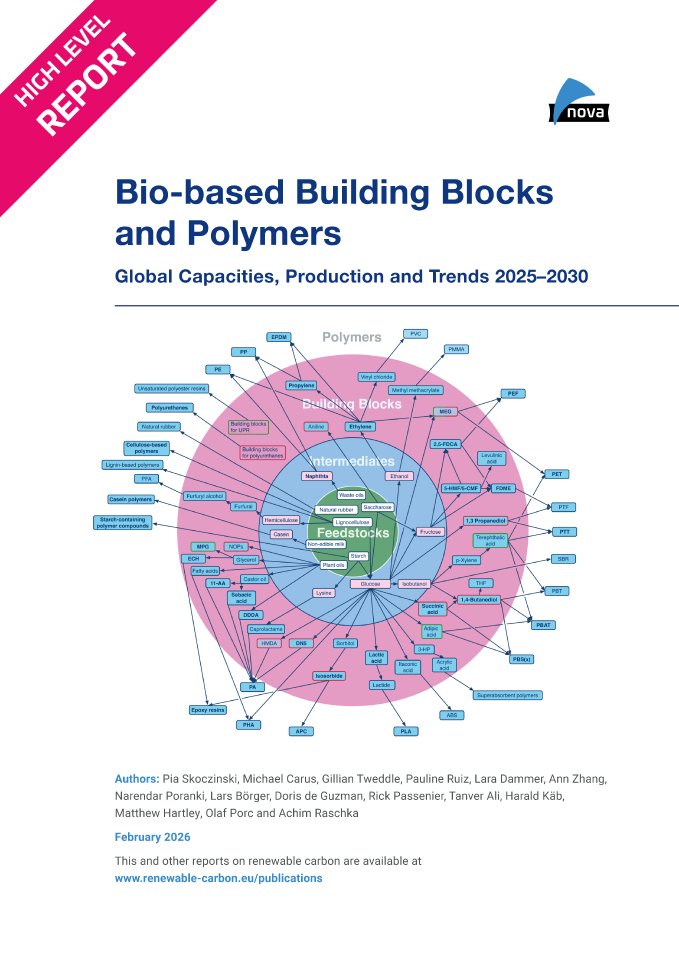
Bio-based Building Blocks and Polymers – Global Capacities, Production and Trends 2025–2030 (PDF)
NewMarkets & Economy
23 Pages
1106 Downloads 1106 Downloads
2026-02
FREE
Free Shipping1106
DownloadsThe new high-level report “Bio‑based Building Blocks and Polymers – Global Capacities, Production and Trends 2025–2030”, compiled by the international biopolymer expert group of the nova-Institute, provides an overview of the capacities and production data of 17 commercially available bio‑based building blocks and polymers in 2025, along with a forecast for 2030. Detailed market data is available via individual workshops and webinars with the biopolymer experts. This data includes capacity development from 2018 to 2030, production data for the years 2024 and 2025, and analyses of market developments per building block, polymer and producers, as well as a statistical analysis of “Mass Balance and Attribution (MBA)” products available worldwide.
2025 was a solid year for bio-based polymers, with an expected overall CAGR of 11 % to 2030 and an average capacity utilisation rate of 86 %. Overall, bio-based non-biodegradable polymers have larger installed capacities and higher utilisation rates than bio-based biodegradable polymers. While 58 % of the total installed capacities are from bio-based non-biodegradable polymers, 42 % are bio-based biodegradable polymers. Bio-based non-biodegradable have an average utilisation rate of 90 % whereas bio-based biodegradable polymers have an average utilisation rate of 81 %. The expected CAGR for both, bio-based non-biodegradable and biodegradable is similar with 10 % and 11 %, respectively.
Epoxy resin and PUR production is growing moderately at 9 and 8 %, respectively, while PE and PP are increasing by 17 % and 94 %. Also, capacities for the biodegradables PHA and PLA are expected to increase until 2030 by 49 % and 16 %, respectively. Commercial newcomers such as casein polymers and PEF have increased production capacity and are expected to continue to grow significantly until 2030.
DOI No.: https://doi.org/10.52548/PILO4285
-
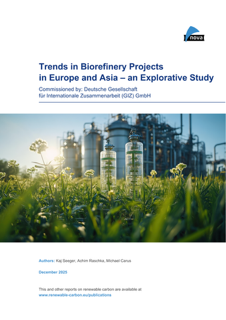
Biorefineries in Asia and the EU – an Explorative Study (PDF)
Markets & Economy, Policy, Technology
58 Pages
155 Downloads 155 Downloads
2026-01
FREE
Free Shipping155
DownloadsThe study aims to provide decision makers with a quick overview over the state of the bioeconomy in Europe and three selected countries in Asia, India, Thailand and Indonesia. Specific attention is placed on biorefineries, as they represent a key building block for the industry. Covered aspects include the political framework, technical pathways and existing infrastructure, alongside case studies. The study provides on-the ground insights from practioners in the field, includes a set of good-practice criteria to assess the prospects of biorefineries and offers a number of specific recommendations for future actions to expand the bioeconomy across continents.