![Renewable Materials Conference 2025 (Proceedings, PDF) [Digital]](https://renewable-carbon.eu/publications/wp-content/uploads/2020/05/21-01-07_RC-Publications-Cover-Proceedings_RMC-100x141.png) Renewable Materials Conference 2025 (Proceedings, PDF) [Digital]
Renewable Materials Conference 2025 (Proceedings, PDF) [Digital] Showing 1–20 of 528
-
Carbon Dioxide Utilisation and Renewable Energy − Graphic (PNG)
Markets & Economy, Technology
1 Page
18 Downloads
18 Downloads
2026-02
FREE
Free Shipping18
Downloads -
Bio-based building blocks – Evolution of capacities to 2030 (PNG)
Markets & Economy
1 Page
14 Downloads 14 Downloads
2026-02
FREE
Free Shipping14
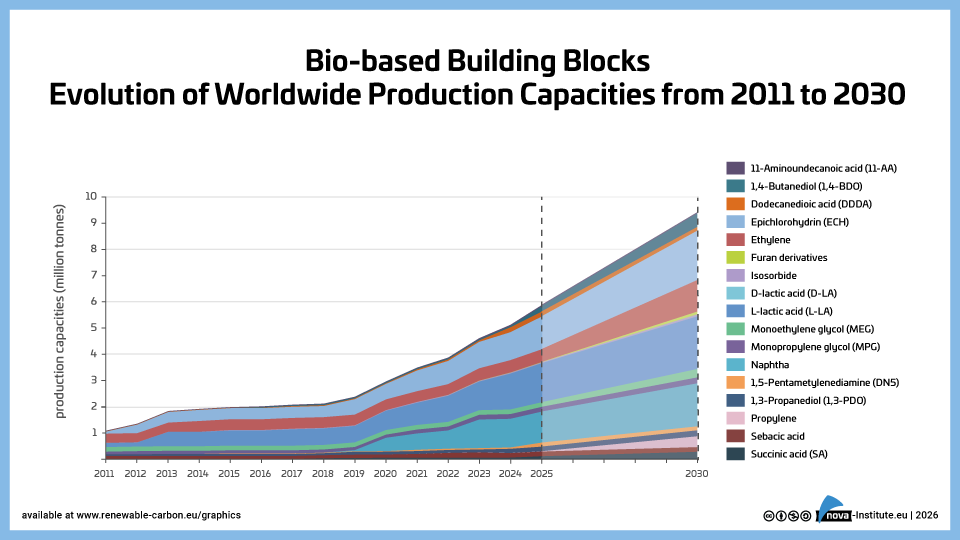
DownloadsThe new high-level report “Bio‑based Building Blocks and Polymers – Global Capacities, Production and Trends 2025–2030”, compiled by the international biopolymer expert group of the nova-Institute, provides an overview of the capacities and production data of 17 commercially available bio‑based building blocks and polymers in 2025, along with a forecast for 2030. Detailed market data is available via individual workshops and webinars with the biopolymer experts. This data includes capacity development from 2018 to 2030, production data for the years 2024 and 2025, and analyses of market developments per building block, polymer and producers, as well as a statistical analysis of “Mass Balance and Attribution (MBA)” products available worldwide.
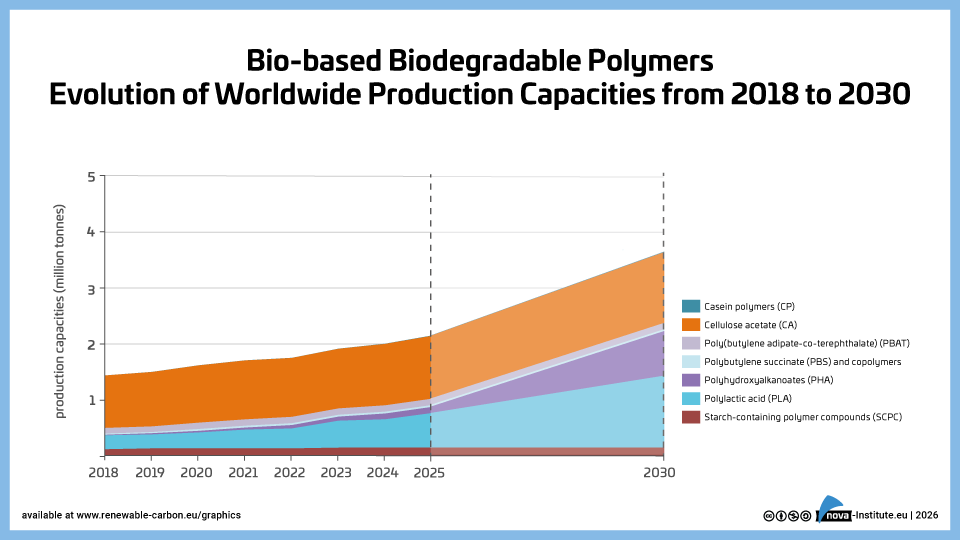
2025 was a solid year for bio-based polymers, with an expected overall CAGR of 11 % to 2030 and an average capacity utilisation rate of 86 %. Overall, bio-based non-biodegradable polymers have larger installed capacities and higher utilisation rates than bio-based biodegradable polymers. While 58 % of the total installed capacities are from bio-based non-biodegradable polymers, 42 % are bio-based biodegradable polymers. Bio-based non-biodegradable have an average utilisation rate of 90 % whereas bio-based biodegradable polymers have an average utilisation rate of 81 %. The expected CAGR for both, bio-based non-biodegradable and biodegradable is similar with 10 % and 11 %, respectively.
Epoxy resin and PUR production is growing moderately at 9 and 8 %, respectively, while PE and PP are increasing by 17 % and 94 %. Also, capacities for the biodegradables PHA and PLA are expected to increase until 2030 by 49 % and 16 %, respectively. Commercial newcomers such as casein polymers and PEF have increased production capacity and are expected to continue to grow significantly until 2030.
DOI No.: https://doi.org/10.52548/PILO4285
-
Bio-based Building Blocks and Polymers – Global Capacities, Production and Trends 2025–2030 (PDF)
NewMarkets & Economy
23 Pages
602 Downloads 602 Downloads
2026-02
FREE
Free Shipping602
DownloadsThe new high-level report “Bio‑based Building Blocks and Polymers – Global Capacities, Production and Trends 2025–2030”, compiled by the international biopolymer expert group of the nova-Institute, provides an overview of the capacities and production data of 17 commercially available bio‑based building blocks and polymers in 2025, along with a forecast for 2030. Detailed market data is available via individual workshops and webinars with the biopolymer experts. This data includes capacity development from 2018 to 2030, production data for the years 2024 and 2025, and analyses of market developments per building block, polymer and producers, as well as a statistical analysis of “Mass Balance and Attribution (MBA)” products available worldwide.
2025 was a solid year for bio-based polymers, with an expected overall CAGR of 11 % to 2030 and an average capacity utilisation rate of 86 %. Overall, bio-based non-biodegradable polymers have larger installed capacities and higher utilisation rates than bio-based biodegradable polymers. While 58 % of the total installed capacities are from bio-based non-biodegradable polymers, 42 % are bio-based biodegradable polymers. Bio-based non-biodegradable have an average utilisation rate of 90 % whereas bio-based biodegradable polymers have an average utilisation rate of 81 %. The expected CAGR for both, bio-based non-biodegradable and biodegradable is similar with 10 % and 11 %, respectively.
Epoxy resin and PUR production is growing moderately at 9 and 8 %, respectively, while PE and PP are increasing by 17 % and 94 %. Also, capacities for the biodegradables PHA and PLA are expected to increase until 2030 by 49 % and 16 %, respectively. Commercial newcomers such as casein polymers and PEF have increased production capacity and are expected to continue to grow significantly until 2030.
DOI No.: https://doi.org/10.52548/PILO4285
-
22 Downloads
2026-02
FREE
Free Shipping22
DownloadsThe new high-level report “Bio‑based Building Blocks and Polymers – Global Capacities, Production and Trends 2025–2030”, compiled by the international biopolymer expert group of the nova-Institute, provides an overview of the capacities and production data of 17 commercially available bio‑based building blocks and polymers in 2025, along with a forecast for 2030. Detailed market data is available via individual workshops and webinars with the biopolymer experts. This data includes capacity development from 2018 to 2030, production data for the years 2024 and 2025, and analyses of market developments per building block, polymer and producers, as well as a statistical analysis of “Mass Balance and Attribution (MBA)” products available worldwide.
2025 was a solid year for bio-based polymers, with an expected overall CAGR of 11 % to 2030 and an average capacity utilisation rate of 86 %. Overall, bio-based non-biodegradable polymers have larger installed capacities and higher utilisation rates than bio-based biodegradable polymers. While 58 % of the total installed capacities are from bio-based non-biodegradable polymers, 42 % are bio-based biodegradable polymers. Bio-based non-biodegradable have an average utilisation rate of 90 % whereas bio-based biodegradable polymers have an average utilisation rate of 81 %. The expected CAGR for both, bio-based non-biodegradable and biodegradable is similar with 10 % and 11 %, respectively.
Epoxy resin and PUR production is growing moderately at 9 and 8 %, respectively, while PE and PP are increasing by 17 % and 94 %. Also, capacities for the biodegradables PHA and PLA are expected to increase until 2030 by 49 % and 16 %, respectively. Commercial newcomers such as casein polymers and PEF have increased production capacity and are expected to continue to grow significantly until 2030.
DOI No.: https://doi.org/10.52548/PILO4285
-
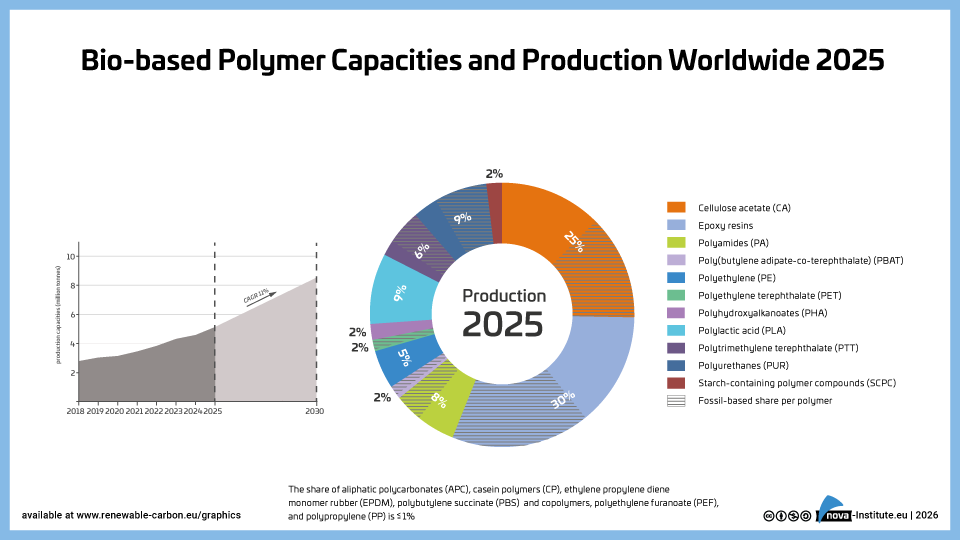
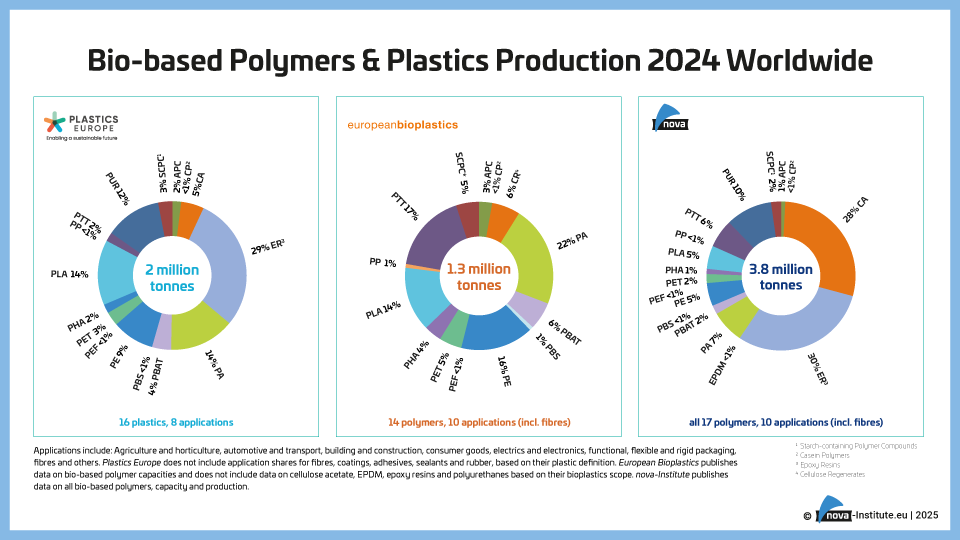
Bio-based Polymer Capacities and Production Worldwide 2025 (PNG)
Markets & Economy
1 Page
23 Downloads 23 Downloads
2026-02
FREE
Free Shipping23
DownloadsThe new high-level report “Bio‑based Building Blocks and Polymers – Global Capacities, Production and Trends 2025–2030”, compiled by the international biopolymer expert group of the nova-Institute, provides an overview of the capacities and production data of 17 commercially available bio‑based building blocks and polymers in 2025, along with a forecast for 2030. Detailed market data is available via individual workshops and webinars with the biopolymer experts. This data includes capacity development from 2018 to 2030, production data for the years 2024 and 2025, and analyses of market developments per building block, polymer and producers, as well as a statistical analysis of “Mass Balance and Attribution (MBA)” products available worldwide.
2025 was a solid year for bio-based polymers, with an expected overall CAGR of 11 % to 2030 and an average capacity utilisation rate of 86 %. Overall, bio-based non-biodegradable polymers have larger installed capacities and higher utilisation rates than bio-based biodegradable polymers. While 58 % of the total installed capacities are from bio-based non-biodegradable polymers, 42 % are bio-based biodegradable polymers. Bio-based non-biodegradable have an average utilisation rate of 90 % whereas bio-based biodegradable polymers have an average utilisation rate of 81 %. The expected CAGR for both, bio-based non-biodegradable and biodegradable is similar with 10 % and 11 %, respectively.
Epoxy resin and PUR production is growing moderately at 9 and 8 %, respectively, while PE and PP are increasing by 17 % and 94 %. Also, capacities for the biodegradables PHA and PLA are expected to increase until 2030 by 49 % and 16 %, respectively. Commercial newcomers such as casein polymers and PEF have increased production capacity and are expected to continue to grow significantly until 2030.
DOI No.: https://doi.org/10.52548/PILO4285
-
25 Downloads
2026-02
FREE
Free Shipping25
DownloadsThe new high-level report “Bio‑based Building Blocks and Polymers – Global Capacities, Production and Trends 2025–2030”, compiled by the international biopolymer expert group of the nova-Institute, provides an overview of the capacities and production data of 17 commercially available bio‑based building blocks and polymers in 2025, along with a forecast for 2030. Detailed market data is available via individual workshops and webinars with the biopolymer experts. This data includes capacity development from 2018 to 2030, production data for the years 2024 and 2025, and analyses of market developments per building block, polymer and producers, as well as a statistical analysis of “Mass Balance and Attribution (MBA)” products available worldwide.
2025 was a solid year for bio-based polymers, with an expected overall CAGR of 11 % to 2030 and an average capacity utilisation rate of 86 %. Overall, bio-based non-biodegradable polymers have larger installed capacities and higher utilisation rates than bio-based biodegradable polymers. While 58 % of the total installed capacities are from bio-based non-biodegradable polymers, 42 % are bio-based biodegradable polymers. Bio-based non-biodegradable have an average utilisation rate of 90 % whereas bio-based biodegradable polymers have an average utilisation rate of 81 %. The expected CAGR for both, bio-based non-biodegradable and biodegradable is similar with 10 % and 11 %, respectively.
Epoxy resin and PUR production is growing moderately at 9 and 8 %, respectively, while PE and PP are increasing by 17 % and 94 %. Also, capacities for the biodegradables PHA and PLA are expected to increase until 2030 by 49 % and 16 %, respectively. Commercial newcomers such as casein polymers and PEF have increased production capacity and are expected to continue to grow significantly until 2030.
DOI No.: https://doi.org/10.52548/PILO4285
-
30 Downloads
2026-02
FREE
Free Shipping30
DownloadsThe new high-level report “Bio‑based Building Blocks and Polymers – Global Capacities, Production and Trends 2025–2030”, compiled by the international biopolymer expert group of the nova-Institute, provides an overview of the capacities and production data of 17 commercially available bio‑based building blocks and polymers in 2025, along with a forecast for 2030. Detailed market data is available via individual workshops and webinars with the biopolymer experts. This data includes capacity development from 2018 to 2030, production data for the years 2024 and 2025, and analyses of market developments per building block, polymer and producers, as well as a statistical analysis of “Mass Balance and Attribution (MBA)” products available worldwide.
2025 was a solid year for bio-based polymers, with an expected overall CAGR of 11 % to 2030 and an average capacity utilisation rate of 86 %. Overall, bio-based non-biodegradable polymers have larger installed capacities and higher utilisation rates than bio-based biodegradable polymers. While 58 % of the total installed capacities are from bio-based non-biodegradable polymers, 42 % are bio-based biodegradable polymers. Bio-based non-biodegradable have an average utilisation rate of 90 % whereas bio-based biodegradable polymers have an average utilisation rate of 81 %. The expected CAGR for both, bio-based non-biodegradable and biodegradable is similar with 10 % and 11 %, respectively.
Epoxy resin and PUR production is growing moderately at 9 and 8 %, respectively, while PE and PP are increasing by 17 % and 94 %. Also, capacities for the biodegradables PHA and PLA are expected to increase until 2030 by 49 % and 16 %, respectively. Commercial newcomers such as casein polymers and PEF have increased production capacity and are expected to continue to grow significantly until 2030.
DOI No.: https://doi.org/10.52548/PILO4285
-
24 Downloads
2026-02
FREE
Free Shipping24
DownloadsThe new high-level report “Bio‑based Building Blocks and Polymers – Global Capacities, Production and Trends 2025–2030”, compiled by the international biopolymer expert group of the nova-Institute, provides an overview of the capacities and production data of 17 commercially available bio‑based building blocks and polymers in 2025, along with a forecast for 2030. Detailed market data is available via individual workshops and webinars with the biopolymer experts. This data includes capacity development from 2018 to 2030, production data for the years 2024 and 2025, and analyses of market developments per building block, polymer and producers, as well as a statistical analysis of “Mass Balance and Attribution (MBA)” products available worldwide.
2025 was a solid year for bio-based polymers, with an expected overall CAGR of 11 % to 2030 and an average capacity utilisation rate of 86 %. Overall, bio-based non-biodegradable polymers have larger installed capacities and higher utilisation rates than bio-based biodegradable polymers. While 58 % of the total installed capacities are from bio-based non-biodegradable polymers, 42 % are bio-based biodegradable polymers. Bio-based non-biodegradable have an average utilisation rate of 90 % whereas bio-based biodegradable polymers have an average utilisation rate of 81 %. The expected CAGR for both, bio-based non-biodegradable and biodegradable is similar with 10 % and 11 %, respectively.
Epoxy resin and PUR production is growing moderately at 9 and 8 %, respectively, while PE and PP are increasing by 17 % and 94 %. Also, capacities for the biodegradables PHA and PLA are expected to increase until 2030 by 49 % and 16 %, respectively. Commercial newcomers such as casein polymers and PEF have increased production capacity and are expected to continue to grow significantly until 2030.
DOI No.: https://doi.org/10.52548/PILO4285
-
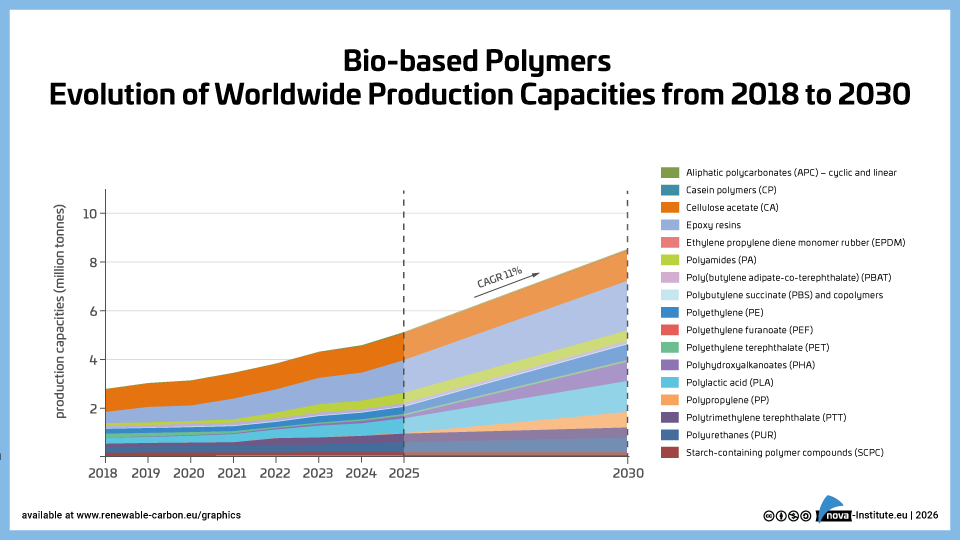
Bio-based polymers – Evolution of worldwide production capacities from 2018 to 2030 (PNG)
Markets & Economy
1 Page
24 Downloads 24 Downloads
2026-02
FREE
Free Shipping24
DownloadsThe new high-level report “Bio‑based Building Blocks and Polymers – Global Capacities, Production and Trends 2025–2030”, compiled by the international biopolymer expert group of the nova-Institute, provides an overview of the capacities and production data of 17 commercially available bio‑based building blocks and polymers in 2025, along with a forecast for 2030. Detailed market data is available via individual workshops and webinars with the biopolymer experts. This data includes capacity development from 2018 to 2030, production data for the years 2024 and 2025, and analyses of market developments per building block, polymer and producers, as well as a statistical analysis of “Mass Balance and Attribution (MBA)” products available worldwide.
2025 was a solid year for bio-based polymers, with an expected overall CAGR of 11 % to 2030 and an average capacity utilisation rate of 86 %. Overall, bio-based non-biodegradable polymers have larger installed capacities and higher utilisation rates than bio-based biodegradable polymers. While 58 % of the total installed capacities are from bio-based non-biodegradable polymers, 42 % are bio-based biodegradable polymers. Bio-based non-biodegradable have an average utilisation rate of 90 % whereas bio-based biodegradable polymers have an average utilisation rate of 81 %. The expected CAGR for both, bio-based non-biodegradable and biodegradable is similar with 10 % and 11 %, respectively.
Epoxy resin and PUR production is growing moderately at 9 and 8 %, respectively, while PE and PP are increasing by 17 % and 94 %. Also, capacities for the biodegradables PHA and PLA are expected to increase until 2030 by 49 % and 16 %, respectively. Commercial newcomers such as casein polymers and PEF have increased production capacity and are expected to continue to grow significantly until 2030.
DOI No.: https://doi.org/10.52548/PILO4285
-
204 Downloads
2026-02
FREE
Free Shipping204
DownloadsBased on internal assessment of RCI member companies and joint analysis, this report reveals existing EU legislation which creates several roadblocks for the shift from fossil to renewable carbon, The report identifies ten concrete policy barriers across seven EU frameworks, including the ETS, REDIII, PPWR and SUPD.
Key findings show regulatory misalignment (creating non-level playing fields and regulatory uncertainty), outdated definitions and misleading classifications (excluding innovative, climate-friendly products from incentives and market access) and impractical administrative bureaucracy (often conflicting with industrial realities). The biggest barrier is not identified in a single regulation, but identified as the lack of coherent support for renewable carbon in the chemicals and derived materials economy.
The report provides practical suggestions to amend and fine-tune regulations in upcoming legislative revisions. It complements RCI’s policy proposal study published in 2025.
-
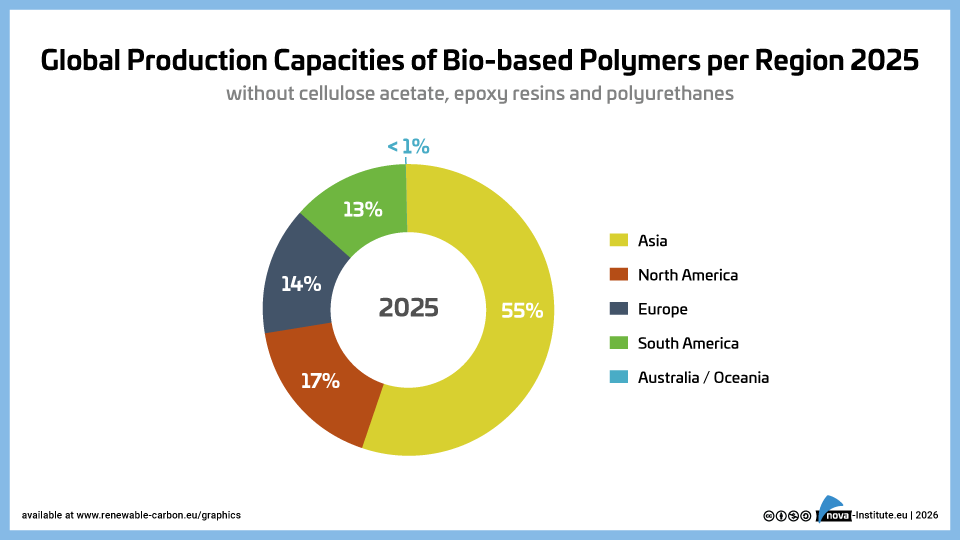
Global Production Capacities of Bio-based Polymers per region 2025 (PNG)
Markets & Economy
1 Page
19 Downloads 19 Downloads
2026-02
FREE
Free Shipping19
DownloadsThe new high-level report “Bio‑based Building Blocks and Polymers – Global Capacities, Production and Trends 2025–2030”, compiled by the international biopolymer expert group of the nova-Institute, provides an overview of the capacities and production data of 17 commercially available bio‑based building blocks and polymers in 2025, along with a forecast for 2030. Detailed market data is available via individual workshops and webinars with the biopolymer experts. This data includes capacity development from 2018 to 2030, production data for the years 2024 and 2025, and analyses of market developments per building block, polymer and producers, as well as a statistical analysis of “Mass Balance and Attribution (MBA)” products available worldwide.
2025 was a solid year for bio-based polymers, with an expected overall CAGR of 11 % to 2030 and an average capacity utilisation rate of 86 %. Overall, bio-based non-biodegradable polymers have larger installed capacities and higher utilisation rates than bio-based biodegradable polymers. While 58 % of the total installed capacities are from bio-based non-biodegradable polymers, 42 % are bio-based biodegradable polymers. Bio-based non-biodegradable have an average utilisation rate of 90 % whereas bio-based biodegradable polymers have an average utilisation rate of 81 %. The expected CAGR for both, bio-based non-biodegradable and biodegradable is similar with 10 % and 11 %, respectively.
Epoxy resin and PUR production is growing moderately at 9 and 8 %, respectively, while PE and PP are increasing by 17 % and 94 %. Also, capacities for the biodegradables PHA and PLA are expected to increase until 2030 by 49 % and 16 %, respectively. Commercial newcomers such as casein polymers and PEF have increased production capacity and are expected to continue to grow significantly until 2030.
DOI No.: https://doi.org/10.52548/PILO4285
-
Bio-based non biodegradable polymers Evolution of Capacities (PNG)
Markets & Economy
1 Page
11 Downloads 11 Downloads
2026-02
FREE
Free Shipping11
DownloadsThe new high-level report “Bio‑based Building Blocks and Polymers – Global Capacities, Production and Trends 2025–2030”, compiled by the international biopolymer expert group of the nova-Institute, provides an overview of the capacities and production data of 17 commercially available bio‑based building blocks and polymers in 2025, along with a forecast for 2030. Detailed market data is available via individual workshops and webinars with the biopolymer experts. This data includes capacity development from 2018 to 2030, production data for the years 2024 and 2025, and analyses of market developments per building block, polymer and producers, as well as a statistical analysis of “Mass Balance and Attribution (MBA)” products available worldwide.
2025 was a solid year for bio-based polymers, with an expected overall CAGR of 11 % to 2030 and an average capacity utilisation rate of 86 %. Overall, bio-based non-biodegradable polymers have larger installed capacities and higher utilisation rates than bio-based biodegradable polymers. While 58 % of the total installed capacities are from bio-based non-biodegradable polymers, 42 % are bio-based biodegradable polymers. Bio-based non-biodegradable have an average utilisation rate of 90 % whereas bio-based biodegradable polymers have an average utilisation rate of 81 %. The expected CAGR for both, bio-based non-biodegradable and biodegradable is similar with 10 % and 11 %, respectively.
Epoxy resin and PUR production is growing moderately at 9 and 8 %, respectively, while PE and PP are increasing by 17 % and 94 %. Also, capacities for the biodegradables PHA and PLA are expected to increase until 2030 by 49 % and 16 %, respectively. Commercial newcomers such as casein polymers and PEF have increased production capacity and are expected to continue to grow significantly until 2030.
DOI No.: https://doi.org/10.52548/PILO4285
-
Bio-based biodegradable polymers-Evolution Capacities to 2030 (PNG)
Markets & Economy
1 Page
13 Downloads 13 Downloads
2026-02
FREE
Free Shipping13
DownloadsThe new high-level report “Bio‑based Building Blocks and Polymers – Global Capacities, Production and Trends 2025–2030”, compiled by the international biopolymer expert group of the nova-Institute, provides an overview of the capacities and production data of 17 commercially available bio‑based building blocks and polymers in 2025, along with a forecast for 2030. Detailed market data is available via individual workshops and webinars with the biopolymer experts. This data includes capacity development from 2018 to 2030, production data for the years 2024 and 2025, and analyses of market developments per building block, polymer and producers, as well as a statistical analysis of “Mass Balance and Attribution (MBA)” products available worldwide.
2025 was a solid year for bio-based polymers, with an expected overall CAGR of 11 % to 2030 and an average capacity utilisation rate of 86 %. Overall, bio-based non-biodegradable polymers have larger installed capacities and higher utilisation rates than bio-based biodegradable polymers. While 58 % of the total installed capacities are from bio-based non-biodegradable polymers, 42 % are bio-based biodegradable polymers. Bio-based non-biodegradable have an average utilisation rate of 90 % whereas bio-based biodegradable polymers have an average utilisation rate of 81 %. The expected CAGR for both, bio-based non-biodegradable and biodegradable is similar with 10 % and 11 %, respectively.
Epoxy resin and PUR production is growing moderately at 9 and 8 %, respectively, while PE and PP are increasing by 17 % and 94 %. Also, capacities for the biodegradables PHA and PLA are expected to increase until 2030 by 49 % and 16 %, respectively. Commercial newcomers such as casein polymers and PEF have increased production capacity and are expected to continue to grow significantly until 2030.
DOI No.: https://doi.org/10.52548/PILO4285
-
Biorefineries in Asia and the EU – an Explorative Study (PDF)
NewMarkets & Economy, Policy, Technology
58 Pages
85 Downloads 85 Downloads
2026-01
FREE
Free Shipping85
DownloadsThe study aims to provide decision makers with a quick overview over the state of the bioeconomy in Europe and three selected countries in Asia, India, Thailand and Indonesia. Specific attention is placed on biorefineries, as they represent a key building block for the industry. Covered aspects include the political framework, technical pathways and existing infrastructure, alongside case studies. The study provides on-the ground insights from practioners in the field, includes a set of good-practice criteria to assess the prospects of biorefineries and offers a number of specific recommendations for future actions to expand the bioeconomy across continents.
-
119 Downloads
2026-01
FREE
Free Shipping119
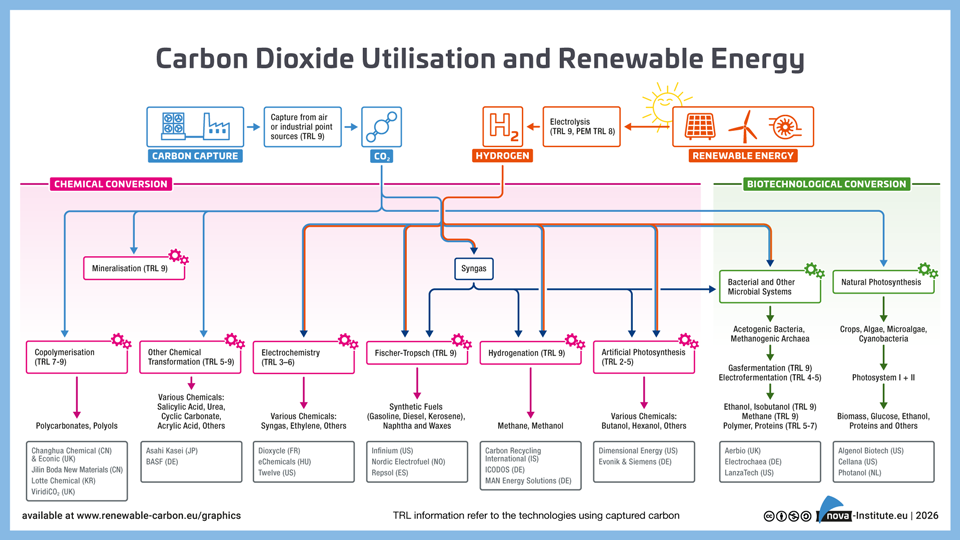
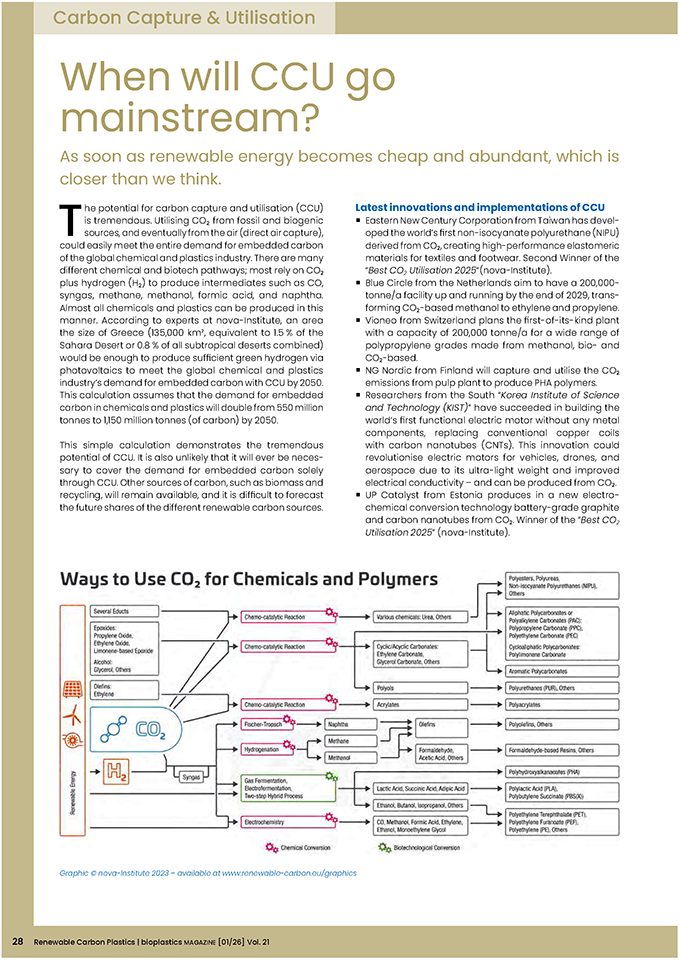
DownloadsAs soon as renewable energy becomes cheap and abundant, which is closer than we think.
The potential for carbon capture and utilisation (CCU) is tremendous. Utilising CO2 from fossil and biogenic sources, and eventually from the air (direct air capture), could easily meet the entire demand for embedded carbon of the global chemical and plastics industry. There are many different chemical and biotech pathways; most rely on CO2 plus hydrogen (H2) to produce intermediates such as CO, syngas, methane, methanol, formic acid, and naphtha.
Almost all chemicals and plastics can be produced in this manner. According to experts at nova-Institute, an area the size of Greece (135,000 km2, equivalent to 1.5 % of the Sahara Desert or 0.8 % of all subtropical deserts combined) would be enough to produce sufficient green hydrogen via photovoltaics to meet the global chemical and plastics industry’s demand for embedded carbon with CCU by 2050. This calculation assumes that the demand for embedded carbon in chemicals and plastics will double from 550 million tonnes to 1,150 million tonnes (of carbon) by 2050. This simple calculation demonstrates the tremendous potential of CCU.
-
Recycling Becomes Feedstock for Europe – Let’s Dare More Autonomy (PDF)
NewPolicy
65 Pages
448 Downloads 448 Downloads
2026-01
FREE
Free Shipping448
DownloadsThe paper shows how this goal of transformation or defossilisation can be implemented step by step and how legal areas can be better integrated at EU level, which will result in new priorities for both sectors. For example, in waste management, much of what does not contribute to the carbon supply of the chemical industry can be phased out gradually. It also includes enabling all recycling technologies, from mechanical and physical to chemical processes and even incineration with CO₂ capture and utilisation, since all processes are needed in the transformation for the different waste fractions and target products. Overall, the ten proposals derived and analysed in the paper also lead to a significant reduction in bureaucracy.
There are some important proposals that build on instruments already introduced by the EU, such as substitution quotas for selected plastics sectors. The authors also specify proposals that are under discussion or being raised by Member States. However, there are also proposals to phase out existing regulations. It is important that the proposals build on each other and are implemented in a coordinated manner as part of a self-contained, phased overall package.
Fortunately, greater autonomy is becoming mainstream in the EU and is also one of the cornerstones of the new EU Council Presidency. However, unless it becomes practical, greater autonomy and resilience will remain nothing more than a narrative. And the path to achieving this will be fraught with difficulties.
DOI No.: https://doi.org/10.52548/LFPX3960
-
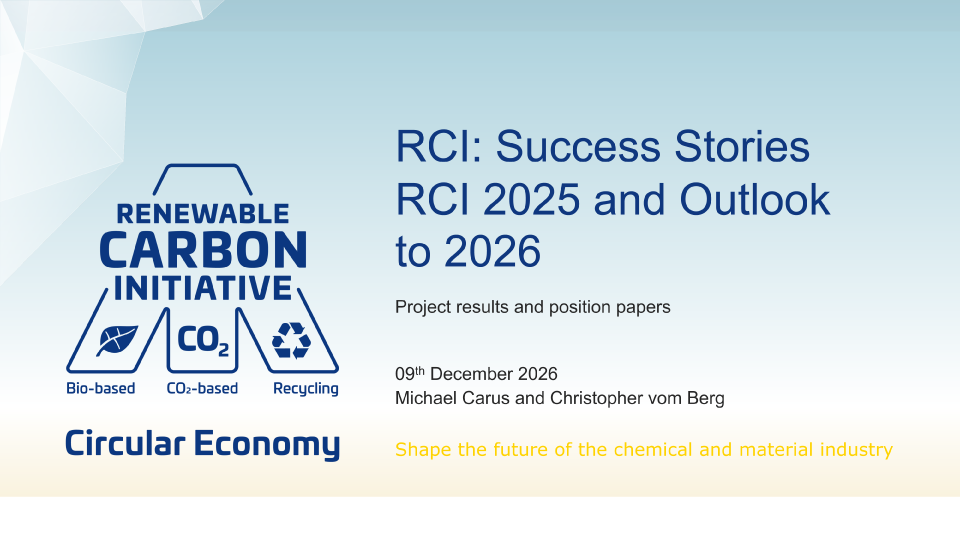
RCI Webinar: Success Stories RCI 2025 and Outlook to 2026 – Project Results and Position Papers (PDF)
Policy, Sustainability & Health
59 Pages
133 Downloads 133 Downloads
2025-12
FREE
Free Shipping133
DownloadsThe free RCI webinar on 9 December 2025 presented the RCI Success Stories 2025 and offered an Outlook to 2026. It showcased RCI’s policy impact at EU, national and international levels, highlighted key publications and scientific results (including the biomass study, Policy Proposals, LCA methodologies, sustainability criteria paper, and analysis of recent updates to methane and fossil CO2 emissions data in Life-Cycle Inventories (LCI)), and summarised member activities such as expert groups, roundtables, and survey insights. The webinar also introduced RCI’s ongoing and upcoming projects for 2026, including biodiversity, policy barriers, carbon flows, LCA case studies, and awareness-building initiatives.
-
Advanced Recycling Conference 2025 (Proceedings, PDF)
Markets & Economy, Policy, Sustainability & Health, Technology
2025-12
150 € ex. tax
Plus 19% MwSt.Press
release Add to
cartThe proceedings of the Advanced Recycling Conference 2025 (19-20 November, https://advanced-recycling.eu) contain 41 conference presentations, the conference journal, sponsor documents and the press release.
-
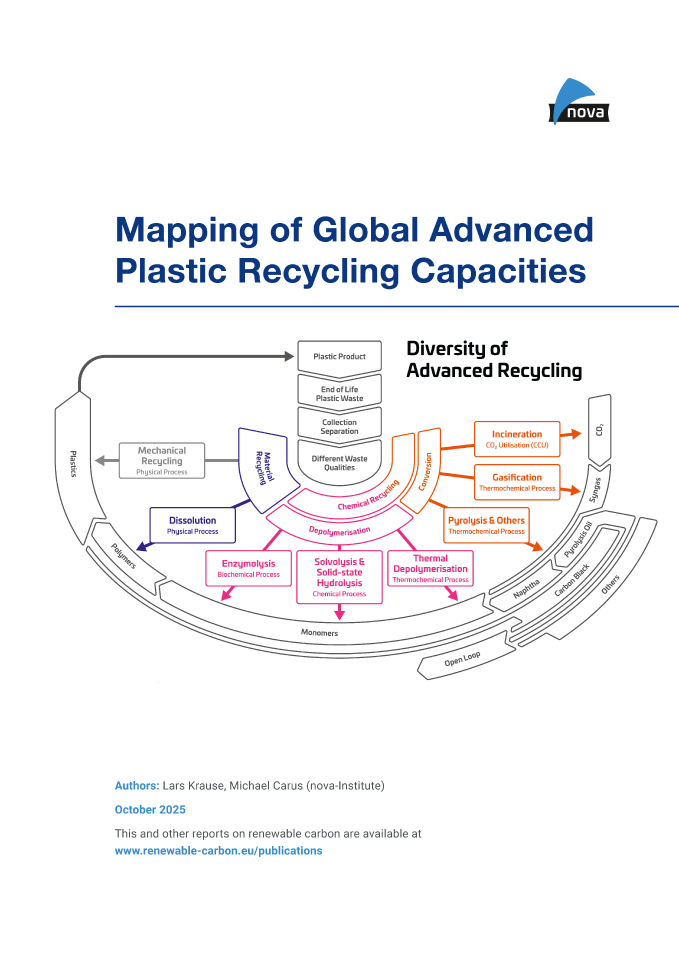
Mapping of Global Advanced Plastic Recycling Capacities (PDF)
NewMarkets & Economy, Policy, Technology
35 Pages
2025-11
500 € – 1,000 €Price range: 500 € through 1,000 € ex. tax
Plus 19% MwSt.Press
release Select
licenceChemical and physical recycling are essential to keeping carbon in the loop and fully establishing a circular economy. Despite delays in policy regulations and investment, experts foresee a bright future for new capacity, both globally and in Europe.
The development of advanced recycling technologies is very dynamic and at a fast pace, with new players constantly appearing on the market, from start-ups to chemistry giants and everything in between. New plants are being built, and new capacities are being achieved. Due to these dynamic developments, it is difficult to keep track of everything. The nova report “Mapping of global advanced plastic recycling capacities” aims to clear up this jungle of information. A comprehensive evaluation of the global input and output capacities was carried out for which 390 planned as well as installed and operating plants including their specific product yields were mapped to provide an overview about global advanced recycling capacities in the past, present, and future.
Further information: The new report represents a short study updating the current and future Advanced Recycling input- and output-capacities for the year 2024-2031. The report does not include any technology- or company-profiles which are published in another study (https://doi.org/10.52548/WQHT8696).
DOI No.: https://doi.org/10.52548/YKWB6074
-
Renewable Materials Conference 2025 (Proceedings, PDF)
Markets & Economy, Policy, Sustainability & Health, Technology
2025-10
200 € ex. tax
Plus 19% MwSt.Press
release Add to
cartThe proceedings of the Renewable Materials Conference 2025 (22-24 September 2025, https://renewable-materials.eu) contain all released 68 presentations, the conference journal and the press release of the three winners of the Innovation Award “Renewable Material of the Year 2025″.