Abstract
We evaluate the potential economic availability of willow (Salix spp.) short‐rotation woody crops in the Northeast USA. Based on results from a 20‐year agronomic simulation, the Northeast USA could potentially provide between 2.1 and 9.7 million dry Mg year−1, depending on farmgate price and competition with other energy crops. In a diversified biomass energy‐crop scenario, willow outperforms other lignocellulosic energy crops in planted area and production at 91% of supply and 83% of planted area in a low‐price scenario in the Northeast USA. In a high‐price scenario, willow also outperforms competing energy crops at 47% of production and 51% of planted area. In contrast with the rest of the USA, willow comprises the greatest portion of energy crop potential in the Northeast. These results suggest that willow has an agronomic comparative advantage in this region as compared to herbaceous energy crops, with great potential to increase production given adequate market prices. © 2018 The Authors. Biofuels, Bioproducts, and Biorefining published by Society of Chemical Industry and John Wiley & Sons, Ltd.
Introduction
Future demand for biomass in the USA is unknown but may grow in response to biofuels, biopower, and bioproducts markets. In addition to the estimated 331 million Mg of biomass used for energy and coproducts in the USA annually, about 750 million to 1.0 billion Mg of biomass are potentially available while meeting demand for conventional food, feed, and fiber markets.1 Biomass resources vary by region. Agricultural residues, forest resources, and perennial grasses are predominately available in the North Central, Southern Plains, and Southeast USA, respectively. Willow (Salix spp.), managed as a short‐rotation woody crop, is well adapted for the growing conditions in Northeast and North Central USA.
Willow is grown commercially on about 500 hectares in the Northeast, predominantly for biopower but also for some other markets.2–4 The Northeast, with about 4.5 million hectares of row crops, 1.7 million hectares of pastureland5 and a population of over 60 million,6 has the potential to increase both production and consumption of bioenergy and associated co‐products. Considering this possible increase in production and use of willow, we evaluate, here, the potential economic availability of biomass from willow in 12 Northeast US states: Connecticut, Delaware, Maine, Maryland, Massachusetts, New Hampshire, New Jersey, New York, Pennsylvania, Rhode Island, Vermont, and West Virginia.
Background
Willow is a genetically diverse genus used for various products. If cultivated judiciously, willow can provide various environmental benefits.7, 8 As a perennial crop with high yields and deep root systems, willow production can provide carbon sequestration while reducing net CO2 emissions compared to conventional energy sources,7, 9–18 though changes in soil organic carbon attributable to short‐rotation woody crop (SRWC) plantations may be difficult to generalize.19 Willows can be effective at absorbing contaminants from groundwater and soil.18, 20–25 Willow production may have competitive advantages on less‐productive lands26–28 and can be used in land remediation.29–31 As with other energy crops, the economic viability of willow production is subject to local operational costs, markets, and policies.26, 32–41
The widespread realization of economic and environmental benefits associated with willow production is contingent upon its potential availability and markets to incentivize production. Approaches for biomass resource assessments are developed according to specific study goals, geographic scope, available data, and other criteria.42–44 The 2016 Billion‐Ton Report (BT16), which included willow as a SRWC, managed on a 20‐year cycle and harvested at 4‐year growth stages, estimated that 23 million Mg per year of willow is potentially available in the USA, assuming a farmgate price of $66 per dry Mg.1 However, this potential supply is subject to assumptions regarding yield, operational cost, market demand, and competition with other crop alternatives.45 Applying the modeling approach used in the BT16,1 here we assess the potential economic availability of willow in the Northeast USA with revised yields and operational assumptions.
Methods
Economic model
This study, consistent with the BT16, employs the Policy Analysis System (POLYSYS) to assess the economic availability of willow supplies within the constraints of land resources and competing demands for other crops. POLYSYS is a policy simulation model for the US agricultural sector.46 Its modeling framework is a variant of an equilibrium displacement model. It has been used to simulate US agricultural policy scenarios. It simulates how commodity markets balance supply and demand through price adjustments based on known economic relationships. POLYSYS can be used to estimate how agricultural producers may respond to new demand for biomass, while considering the impact on other non‐energy crops. It was used to quantify potential biomass resources in the US Department of Energy Billion‐Ton reports and has been used in other agricultural and biofuels analyses.1, 47–55
POLYSYS fixes its analyses to the USDA‐published baseline of price projections, yield, and acreage for the agriculture sector. It extends the USDA 10‐year baseline projection period through 2040 for this analysis.56 Conventional crops considered in POLYSYS include corn, soybeans, grain sorghum, oats, barley, wheat, cotton, rice, and hay. These crops comprise approximately 90% of the US agricultural land area. Corn, grain sorghum, oats, barley, and wheat (winter plus spring) are simulated to produce residues under specified conditions. Production costs associated with residue removal from these crops include replacement of embodied nutrients and per‐acre harvest costs associated with shredding, raking, baling (with a large square baler; see Appendix C.3 of BT16), and transportation to the field edge. Second‐generation dedicated biomass energy crops including switchgrass, miscanthus, poplars, sorghum, energycane, southern pine, and willow are added to the analysis to respond to simulated demands for biomass. Production costs associated with these energy crops include establishment, maintenance, and per acre harvest costs – see Appendix C.3 of BT16.1 Key POLYSYS inputs related to willow production include yields and operational assumptions, described below.
Willow yield model
The yields for the BT16 were derived from modeling activities of the Sun Grant Regional Partnership (RFP), led by South Dakota State University. As reported in Daly et al.,57 supply estimates of the BT16 include national modeling of eight specific dedicated energy crops, including willow, sorghum, energy cane, eucalyptus, miscanthus, poplar, switchgrass, and pine. For each of the energy crops, a 30 m gridded suitability index (index ranges from 0 to 100) was generated and transformed to actual yields using a curated set of uniformly managed field trials or historical data as described in Lee et al.,58 Volk et al.,59 and Daly et al.57 Actual yields represent the ‘best local variety’ of each crop, assuming uniformly applied best management practices, or, in the case of willow and poplar, the top three cultivars. To obtain a county‐level yield average estimate, the yield estimate is summarized using the zonal stats tool within the ArcMAP (ESRI, Redlands, CA, USA) 10.2.2 spatial analyst toolpak across 3109 counties in the contiguous lower 48 US states. Upon further review after publishing the BT16, one of the willow field trials was deemed unrepresentative, and the yield transformation function was adjusted, and the R2 changed from 0.74 to 0.81, which is published in Volk et al.59 The county‐level yield for 299 counties within the Northeast region is utilized as the mean annual increment (MAI) at harvest for willow on a 4‐year cutting cycle.
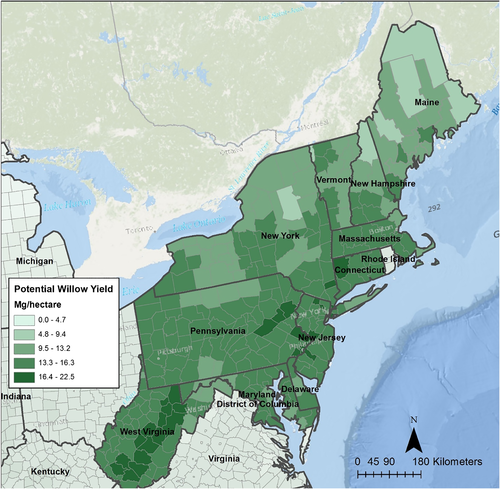
Field results suggest that genetic selection holds promise for increasing yields. As modeled under work by RFP, yield improvements associated with new willow cultivars typically ranged from 15% to 25%.59 The yield of the top three willow cultivars across all research sites in the RFP study range from 3.6 to 14.6 dry Mg per ha per year. Willow yields for the study region range from 11.3 to 15.6 dry Mg per ha per year compared to yields used in the BT16 ranging from 12.4 to 14.7 Mg per ha per year. Revised county‐level modeled yields are shown in Fig. 1. Consistent with the BT16, yields of planting stock are assumed to improve over time due to a combination of selective breeding and improved production practices. In the reference case, yields are assumed to improve 1%, compounding annually, with yields constant throughout the life of a stand, but realized upon replanting. Thus, for a 20‐year rotation, in practice, yields are fixed for a given stand.
Figure 1
Production budgets and operational assumptions
Costs of willow production are a function of operations (establishment, maintenance, and harvest) and yields (dry Mg per hectare at harvest). Consistent with the BT16, we based willow budgets on the EcoWillow model from State University of New York College of Environmental Science and Forestry. Willow is modeled as a coppiced crop over a 20‐year period, with harvest every 4 years. Operational assumptions are established and budgeted in the economic model. In the fall before planting, establishment uses brush hogging, plowing, and disking, and a cover crop is planted. In year 1, the cover crop is also killed, willow cuttings are planted at 13,590 per ha, a pre‐emergent herbicide is applied after planting, and additional weed control occurs. As the final step in year 1, the willows are cut down but not harvested to encourage multiple coppice stems, and additional weed control occurs. Other operations are consistent with the BT16 (USDOE 2016, Appendix C, section 4), except for the following modifications:
Modification from bushhog and tractor harvesting to a forage harvester.
- Diesel consumption is based on horsepower.60
- Willow equipment is updated to a four‐wheel‐drive tractor associated with a wagon for harvest, and a 2wd 85 hp tractor associated with the step planter.
- Limestone application was eliminated because less than 25% of the fields need this fertilizer and, as per the Willow Producer’s Handbook, 61 urea is now being used as a source of nitrogen at a rate of 112 kg per ha.
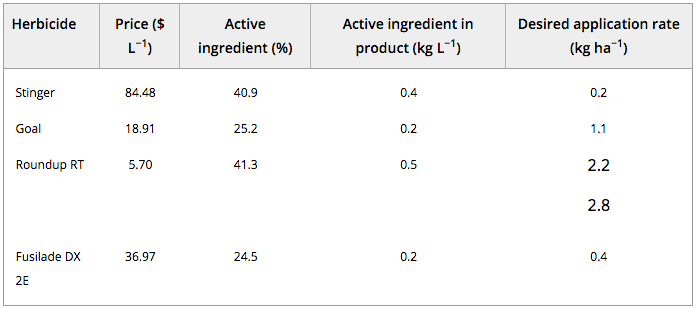
- Updated herbicide assumptions are shown in Table 1.
Table 1. State average willow yield, mean annual increment at harvest (in Mg ha−1), as used in the BT16 and this analysis.
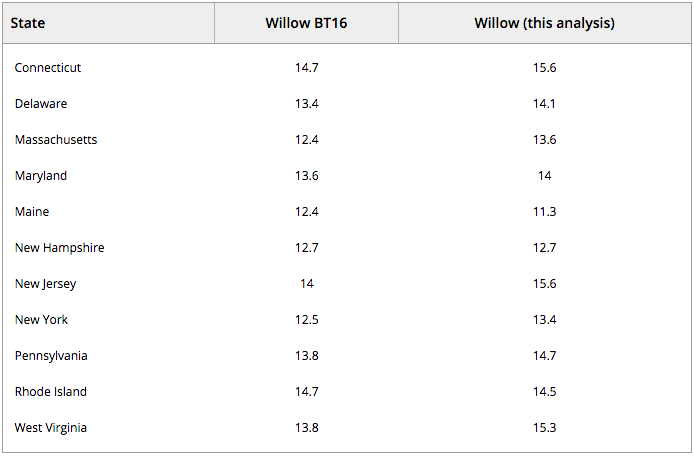
Table 2. Herbicide application rates.
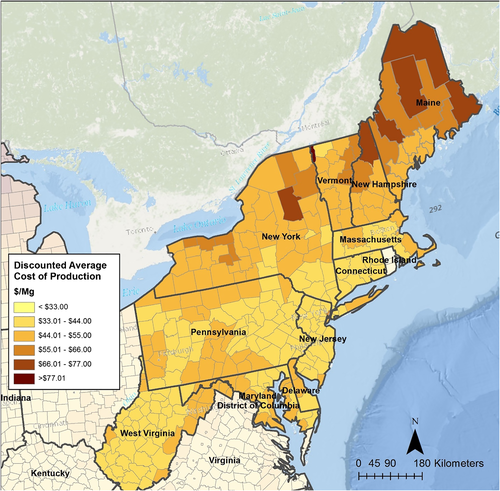
Due to the multi‐year nature of willow production, future costs are discounted to present value. Costs are divided by the present value of harvestable biomass to create a discounted average cost of production at the farm gate. Assuming a discount rate of 5.5%, average costs across the Northeast region are $12.84 per Mg for establishment, $1.63 per Mg for maintenance, and $19.51 per Mg for harvest, to total $34.00 per Mg. The sunk cost of land is excluded. When varying the yield by the Parameter‐elevation Relationships on Independent Slopes‐Environmental Limitation Model (PRISM‐ELM)57 estimates (Mg per hectare), county‐level base‐case discounted average production costs ($ per Mg) are shown in Fig. 1.
Figure 2
Scenarios
Willow supply is modeled in two scenarios. First, the cumulative scenario assumes willow to be one of a mix of biomass energy crops (e.g., switchgrass, poplars, etc.). This scenario can be conceptualized as a market that offers uniform market prices for all biomass crops in competition with conventional crops, with POLYSYS solving for the most profitable mix of crop options. In this scenario, willow competes not only with conventional crops and pasture for land, but also with other energy crops. This scenario is consistent with the cumulative base‐case scenario from the BT16, and is best suited for indicating the total potential supply of biomass from a broad mix of energy crops, including both willow and other woody and herbaceous energy crops.
In the second scenario, willow is modeled in the absence of other biomass energy crops. This scenario can be conceptualized as a market that generates demand for biomass from willow while meeting demand for conventional crops, but without demand for other woody or herbaceous biomass energy crops. This scenario is better suited for indicating the total potential production of willow, due to the lack of competition with other biomass energy crops.
Results from the cumulative scenario, ceteris paribus, can be expected to include more total biomass, but less willow, due to competition with other biomass energy crops. Conversely, the willow‐only scenario results in less total biomass availability at a given price, but more potential supply from willow. Prices are reported at $44, 66, and 88 per dry Mg at the farmgate (i.e., as wood chips at the farm gate, but before transportation). In both environments it is assumed that in year 1 of the analysis, prices for long‐term contracts are offered to producers.
A sensitivity analysis is subsequently presented to illustrate changes in potential supply with varying yield improvement and cost assumptions. For the yield improvement assumption, availability in the Northeast is presented under 0%, 1% (reference case), and 2% annual yield improvement scenarios.
Results and discussion
The results of production and harvested acres vary by price and scenario. Production for the 20‐year simulation are summarized in Table 1. In the Northeast, under the cumulative scenario (i.e., in competition with conventional crops and other energy crops), 2.1, 5.9, and 6.4 million Mg are potentially available at farmgate prices of $44, $66, and $88 per Mg, respectively. In the Northeast under the willow‐only scenario (i.e., willow in competition with conventional crops but without other energy crops) 2.4, 8.9, and 9.7 million Mg are potentially available at farmgate prices of $44, $66, and $88 per Mg, respectively. Overall, the quantities in the Northeast represent about 5–9% of the national potential supply, which is largely available in the lake states region. These results for the Northeast indicate willow produced in the cumulative scenario realizes about 66–88% of willow’s potential without other energy crops in the willow‐only scenario. In the cumulative scenario, willow comprises 91%, 69%, and 47% of energy crop supplies in the Northeast at farmgate prices of $44, $66, and $88 per dry ton, respectively, while willow comprises 45%, 26%, and 17% of energy crop supplies in the remaining contiguous US states at farmgate prices of $44, $66, and $88 per dry ton, respectively. These results suggest that willow has a competitive agronomic advantage over other energy crops in the Northeast USA. Land area under cultivation associated with this production is shown in Table 1.
Table 3. Summary of national potential production of willow, other short‐rotation woody crops, and herbaceous energy crops under three farmgate prices and two production scenarios, for the Northeast and remaining contiguous USA in parenthesis (million dry Mg) after a 20‐year simulation.
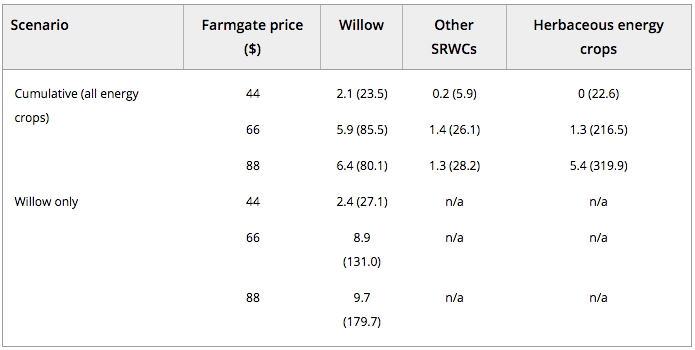
Table 4. Summary of land area under cultivation of willow, other short‐rotation woody crops, and herbaceous energy crops under three farmgate prices and two production scenarios, for the Northeast and remaining contiguous USA in parenthesis (million hectares) after a 20‐year simulation.
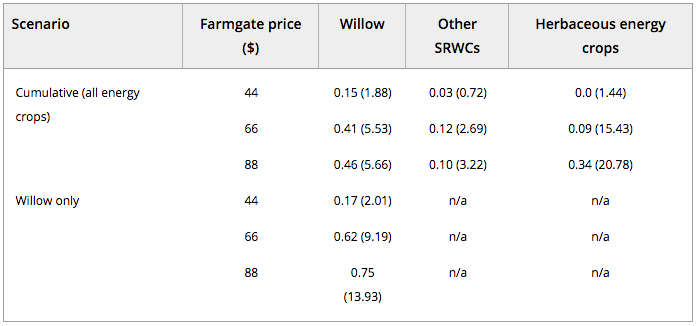
The areas in production associated with the results in Table 1 for the 20‐year simulation are summarized in Table 1. In the Northeast, under the cumulative scenario, 0.15, 0.41, and 0.46 million hectares are in willow production at farmgate prices of $44, $66, and $88 per Mg, respectively. In the Northeast under the willow‐only scenario 0.17, 0.62, and 0.75 million are in willow production at farmgate prices of $44, $66, and $88 per Mg, respectively. Consistent with production, land area under cultivation illustrates comparative advantages of willow as compared to other energy crops in the Northeast. Potential production and production land area are shown for Northeast states individually, as a region, and compared to the rest of the United States, at 5‐year increments, in Tables 1–1.
Table 5. Willow production in a cumulative base case scenario for the Northeast and remaining contiguous USA, in million Mg per year.
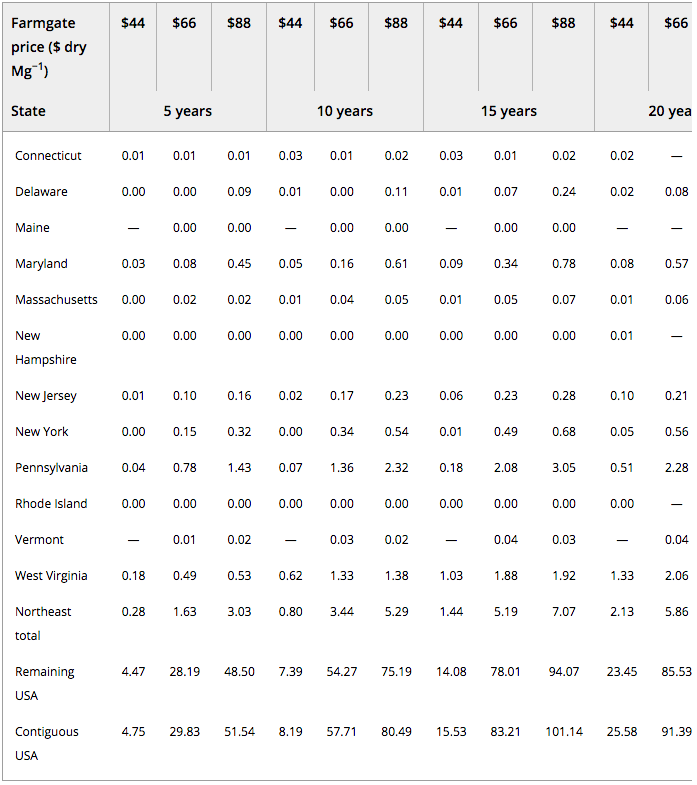
Table 6. Willow planted hectares in a cumulative base case scenario for the Northeast remaining contiguous USA, in millions of hectares per year.
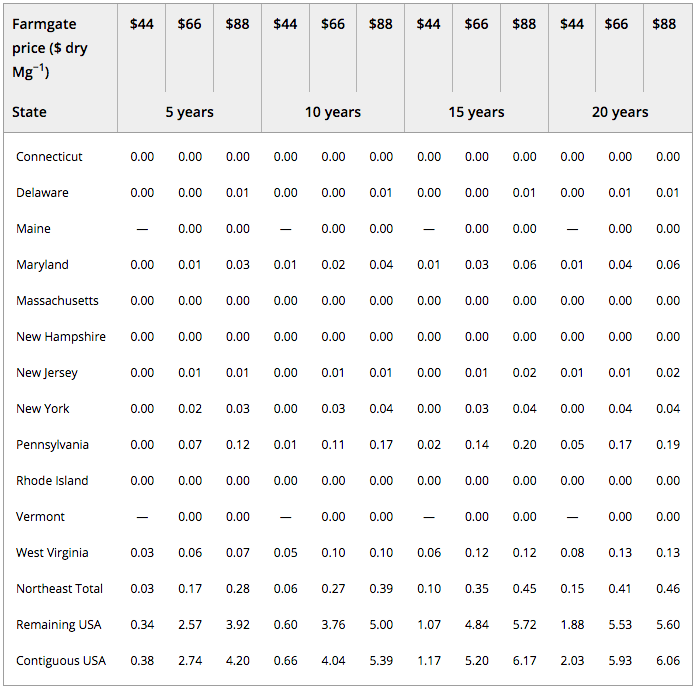
Table 7. Willow production in a willow‐only (no other cellulosic energy crops) scenario for the Northeast and remaining contiguous USA, in million Mg.
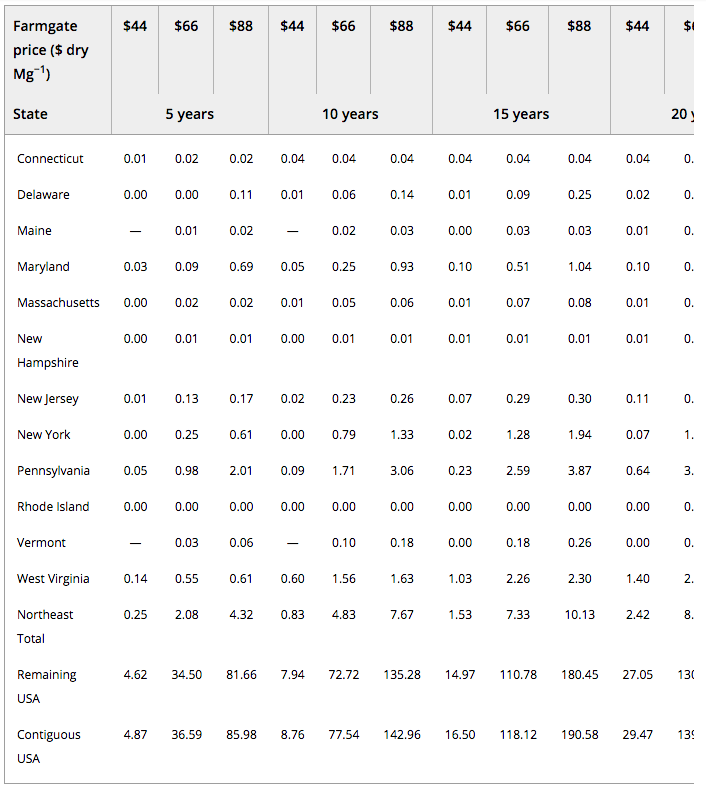
Table 8. Willow planted area in a willow‐only (no other cellulosic energy crops) scenario for the Northeast and remaining contiguous USA, in million hectares.
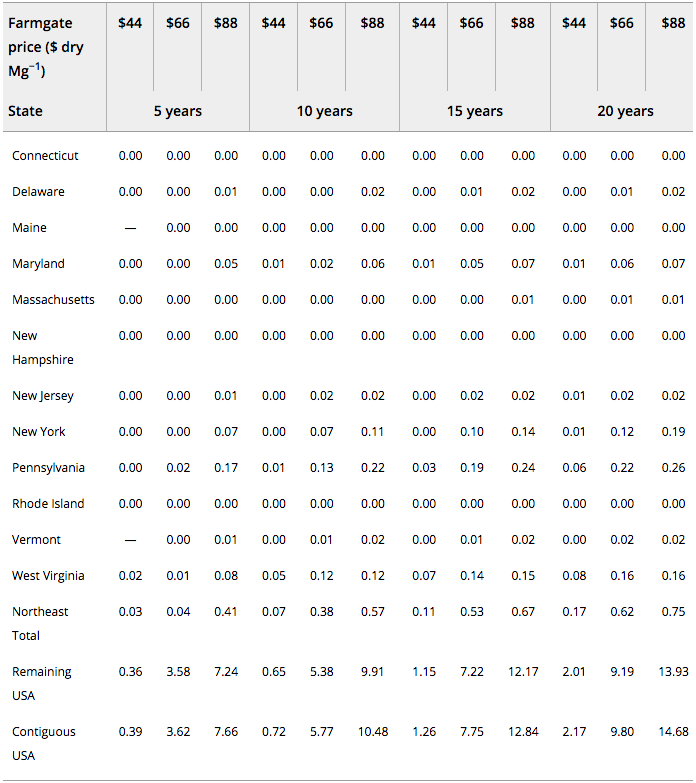
Results are comparable with those reported in the BT16. For the 12 NE states under the cumulative scenario, the results of these analysis are 89%, 79%, and 101% of the potential supplies reported for $44, $66, and $88 per dry Mg reported in the BT16. Under the willow‐only scenario, results presented here are 96%, 102%, and 104% of the potential supplies reported for $44, $66, and $88 per dry Mg from a simulation using the BT16 assumptions.
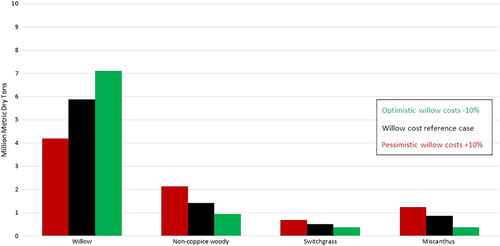
A sensitivity analysis was performed to evaluate potential supply sensitivity to assumptions regarding both yield improvement and costs. For the yield improvement assumption, sensitivity to 0% and 2% annual yield improvement of all energy crops was compared to the reference case (1% annual yield improvement). For costs, sensitivity to plus and minus 10% of willow production budgets was compared to the reference case. For the Northeast States, responses to the 2% yield improvement in the cumulative reference case result in a gain of 3.15 million dry tons (54%) for willow, 0.96 million dry tons (68%) for non‐coppice SRWC, and 3.0 million dry tons for herbaceous energy crops (a 139% and 264% increase for switchgrass and miscanthus, respectively). In a pessimistic yield scenario, willow losses are affected less, with a 1.55 million dry ton (26%) reduction. In this pessimistic yield scenario, all other energy crops are affected as well, with losses in non‐coppice SRWC at 0.31 million dry tons (22%), and 0.85 million dry tons (62%) for herbaceous energy crops (Fig. 1). The sensitivity to cost in the cumulative reference case is less dramatic but shows, in an optimistic case, that there can be an increase in willow of 1.23 million metric dry tons in year 20, or 14% of total willow production in this region.
These gains are offset by a loss in every other crop: 33% non‐coppice SRWC, and 47% for herbaceous energy crops (switchgrass and Miscanthus). Under a pessimistic cost scenario (+10% for harvest and yearly input costs), the impact on willow production is even more significant: a loss of 1.68 million dry tons in year 20, or 29% of total willow production in this region. In contrast with an optimistic willow cost scenario, other energy crops respond with gains of 33% for non‐coppice SRWCs and 38% for herbaceous energy crops (Fig. 1).
Figure 3
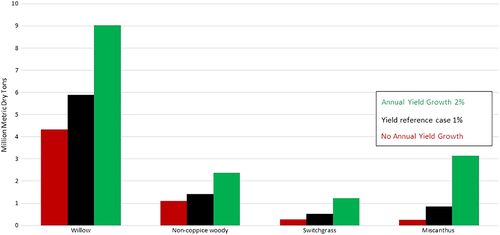
Figure 4
Conclusions
Under reference‐case yields and costs for a 20‐year simulation, the Northeast has the potential to produce between 2.1 and 9.7 million dry Mg of willow, depending on the price offered and potential competition with other energy crops. At a farmgate price of $66 per dry Mg, the Northeast states with the greatest potential for willow production include Pennsylvania, West Virginia, New York, and Maryland, producing 39%, 35%, 10%, and 10% of the potential willow supply, respectively. Willow comprises the greatest portion of energy crop potential at all simulated farmgate price levels in the Northeast, indicating that willow has a comparative agronomic advantage over other energy crops in this region. In contrast, in the remaining lower 48 states, the energy crop potential is dominated by herbaceous energy crops.
However, willow comprises approximately 45% of the potential energy crops supply of the lower 48 states at the lowest simulated farmgate price, suggesting that willow may have comparative advantages at lower prices, regardless of region. Results are limited by county‐level average yields and operational assumptions, and uniform demand for feedstocks across counties. Future work is needed to understand better the impacts of region‐ or site‐specific operational assumptions, operational constraints, annual yield variability, scenario‐specific market conditions, and externality tradeoffs.
Acknowledgements
This research was supported by Agriculture and Food Research Initiative Competitive Grant No. 2012‐68005‐19703 from the USDA National Institute of Food and Agriculture.
This research was supported by the USDA‐funded Northeast Woody Biomass Energy Consortium.
This manuscript has been co‐authored by UT‐Battelle, LLC, under contract DE‐AC05‐00OR22725 with the US Department of Energy (DOE). The US government retains and the publisher, by accepting the article for publication, acknowledges that the US government retains a nonexclusive, paid‐up, irrevocable, worldwide license to publish or reproduce the published form of this manuscript, or allow others to do so, for US government purposes. DOE will provide public access to these results of federally sponsored research in accordance with the DOE Public Access Plan (http://energy.gov/downloads/doe‐public‐access‐plan).
The views and opinions of the authors expressed herein do not necessarily state or reflect those of the United States government or any agency thereof. Neither the United States government nor any agency thereof, nor any of their employees, makes any warranty, expressed or implied, or assume any legal liability or responsibility for the accuracy, completeness, or usefulness of any information, apparatus, product, or process disclosed, or represents that its use would not infringe privately owned rights.
Source
Wiley Online Library, press release, 2018-10-11.
Supplier
College of Environmental Science and Forestry - SUNY
Cornell University (USA)
National Institute of Food and Agriculture (NIFA)
Oak Ridge National Laboratory
Society of Chemical Industry (SCI)
US Department of Agriculture (USDA)
US Department of Energy (DoE)
UT-Battelle
Share
Renewable Carbon News – Daily Newsletter
Subscribe to our daily email newsletter – the world's leading newsletter on renewable materials and chemicals


