The EU-28 bioeconomy is worth 2 trillion euro, providing 19 million jobs, according to a new study by nova-Institute that Il Bioeconomista can publish in preview. The two authors of the study, Stephan Piotrowski and Michael Carus, present an estimation of employment and turnover in the European bio-based economy mainly based on available statistical information from Eurostat (referring to 2011).
“Most of the sectors – Piotrowski and Carus say – can be regarded as fully bio-based (agriculture, forestry and fishery as well as the manufacture of food products, beverages, tobacco products, paper and paper products, forest-based industry and biofuels).
Only for two of the sectors, the textile industry and the chemical and plastics industry, estimations for the bio-based shares were necessary. For the textile industry, the two authors assumed a bio-based share of 40% which is the share of natural fibers in total world fiber market (The Fiber Year 2014) and for the chemical industry they assumed a bio-based share of 5% which is the estimated share of renewable raw materials in total material consumption of the European chemical industry according to the European Chemical Industry Council (CEFIC 2014, Piotrowski et al. al. 2015). These estimates could be further broken down to product level and refined in the future.
Apart from an overall assessment Piotrowski and Carus present a comparison of energy and material uses of biomass based on the same amount of biomass by taking the effects generated by biofuels and the material use of biomass in the chemical industry as an example.
“According to SBS (Structural Business Statistics, editor’s note) – the two authors write – employment in the manufacture of chemicals and chemical products (NACE Division 20) amounted to 1.2 million in the EU-28 in 2011. We have estimated that the bio-based feedstock used in the EU chemical industry amounts to about 8.56 million tonnes dry matter (tdm) or about 5% of its total raw material input in the chemical industry (CEFIC 2014, Piotrowski et al. al. 2015). Roughly, employment due to bio-based chemicals and chemical products could therefore also be considered to amount to 5% of the total employment, i.e. 60,000”.
Here you can find the nova-Institute’s paper.
1 Employment and turnover in the bio-based economy
Authors: Dr. Stephan Piotrowski and Michael Carus, nova-Institute (www.nova-institut.eu)
>> Slightly updated version from 2015-05-26 (in the older version the figure 4a and 4b had a wrong y-axis) <<
The following paragraphs present an estimation of employment and turnover in the European bio-based economy mainly based on available statistical information from Eurostat. Apart from an overall assessment we present a comparison of energy and material uses of biomass based on the same amount of biomass by taking the effects generated by biofuels and the material use of biomass in the chemical industry as an example.
- Overall assessment
The following two figures show the total employment and turnover of the bioeconomy in the EU-28 in the year 2011. These two figures are almost entirely based on available Eurostat data (Eurostat 2013a – d). Most of the sectors can be regarded as fully bio-based (agriculture, forestry and fishery as well as the manufacture of food products, beverages, tobacco products, paper and paper products, forest-based industry and biofuels).
Only for two of the sectors, the textile industry and the chemical and plastics industry, estimations for the bio-based shares were necessary. For the textile industry, we assumed a bio-based share of 40% which is the share of natural fibers in total world fiber market (The Fiber Year 2014) and for the chemical industry we assumed a bio-based share of 5% which is the estimated share of renewable raw materials in total material consumption of the European chemical industry according to the European Chemical Industry Council (CEFIC 2014, Piotrowski et al. al. 2015). These estimates could be further broken down to product level and refined in the future.

Figure 1: Employment in the EU bioeconomy in 2011 (Several Eurostat datasets; Agriculture: Agricultural labour input statistics; Forestry and Fishery: Employment by sex, age and detailed economic activity; Other sectors: Annual detailed enterprise statistics for industry; own estimations)

Figure 2: Turnover in the EU bioeconomy in 2011 (Several Eurostat databases; Agriculture: Economic accounts for agriculture; Forestry: Economic accounts for forestry and logging; Fishery: data missing; Other sectors: Annual detailed enterprise statistics for industry; own estimations)
Turnover and employment in the bioeconomy in all EU-28 Member States can also be compared in one graph (Figure 3). Such a comparison highlights the differences between countries with very high turnover in relation to the employment (e.g. Germany) and countries with the opposite relation (e.g. Poland, where the agricultural sector generates a lot of employment but comparatively little turnover). Please note, however, that the data for this figure has not been checked very carefully and that this figure therefore should only serve as an illustration.

Figure 3: Turnover in the EU bioeconomy: Overall comparison in all EU-28 Member States (Several Eurostat databases; Agriculture: Economic accounts for agriculture; Forestry: Economic accounts for forestry and logging; Fishery: data missing; Other sectors: Annual detailed enterprise statistics for industry; own estimations)
- Comparison between material and energy uses
In this section, we compare the employment and turnover generated by biofuels and material use of biomass in the chemical industry based on the same biomass input. First, we explain in the following paragraphs in more detail how the data for both sectors have been calculated.
- Employment in the manufacture of biodiesel
In Eurostat, statistics on biodiesel can be found in the database PRODCOM under the code 20.59.59.97. The first four digits of this code signify that it belongs to the NACE Class 20.59 “Manufacture of other chemical products n.e.c. (not elsewhere classified)”. According to the Eurostat database Structural Business Statistics (SBS), the total number of employed persons in NACE Class 20.59 amounts to 134,400 in the EU-28 in 2011. However, this database only presents statistics on Class level, not further broken down to product level. Data on employment in the manufacture of biodiesel can therefore not be directly found in Eurostat. To circumvent this problem, we make the following approximation:
According to PRODCOM, the production value of biodiesel is about 7 bln Euro, which is 14% of the total production value of NACE Class 20.59 of about 50 bln Euro. Under the assumption that the relation between production value and employment is about the same in the chemical industry, we therefore assumed that also the employment in the manufacture of biodiesel is about 14% of the total employment in the NACE sector 20.59. This results in an employment of about 19,000.
- Employment in the manufacture of bioethanol
Ethanol for industrial uses can be found under the PRODCOM code 20.14.75.00 “Denatured ethyl alcohol and other denatured sprits” and code 20.14.74.00 “Undenatured ethyl alcohol”. According to Eurostat (SBS), the total number of employed persons in NACE Class 20.14 “Manufacture of other organic basic chemicals” amounts to 202,600. Like for biodiesel, we approximate the employment in the manufacture of bioethanol:
The sum of the production value of both PRODCOM codes in which ethanol can be found amounts to about 3 bln Euro in the EU-28 in 2011. The production value of NACE Class 20.14 amounts to about 136 billion Euro. Ethanol therefore has a share of the production value of about 2%. Again we assumed that also the employment in the manufacture of bioethanol is about 2% of the total employment in the NACE Class 20.14. This results in an employment of about 4,000.
- Employment in the material use of biomass in the chemical industry
According to SBS, employment in the manufacture of chemicals and chemical products (NACE Division 20) amounted to 1.2 mln in the EU-28 in 2011. We have estimated that the bio-based feedstock used in the EU chemical industry amounts to about 8.56 mln tonnes dry matter (tdm) or about 5% of its total raw material input in the chemical industry (CEFIC 2014, Piotrowski et al. al. 2015). Roughly, employment due to bio-based chemicals and chemical products could therefore also be considered to amount to 5% of the total employment, i.e. 60,000.
- Comparison between energy and material use of biomass
In total, the employment for the manufacture of biodiesel and biofuels amounts to about 23,000 (19,000 for biodiesel and 4,000 for bioethanol). We calculated the feedstock demand for EU biofuels to be around 26.8 mln tdm (16.5 mln t plant oil for biodiesel and 10.3 mln t sugar/starch for bioethanol; Piotrowski et al. 2015). The employment in the manufacture of biofuels therefore amounts to about 860 jobs per 1 mln t of bio-based feedstock.
Given the feedstock input of 8.56 mln tdm of biomass for material uses in the chemical industry, the estimated 60,000 jobs are equivalent to about 7,000 jobs per 1 mln t of feedstock. We therefore conclude that the material use of biomass in the chemical industry generates about 8 times more employment than the use of biomass for biofuels, based on the same biomass input.
- Employment generated in agriculture
The assessment so far only considered employment generated in the industrial manufacture of biofuels and chemicals.
According to FADN 2013, the total labour input in Europe needed for the operation of a farm amounts to between 30 h/ha for the cultivation of wheat and 60 h/ha for the cultivation of maize. Converted into full-time equivalents (FTE; 1 FTE = about 2,000 h), this results in 0.015 FTE/ha for wheat and 0.03 FTE/ha for maize. Furthermore, we assume an average feedstock yield of about 2 t/ha and that only about 50% of feedstocks needed for the production of biofuels (26.8 mln t) are actually produced in the EU (13.4 mln t). This very rough approximation leads to an employment of about 100,000 to 200,000 in the EU for the production of the feedstocks needed for European biofuels.
Adding this estimate to the employment in the manufacture of biofuels leads to the conclusion that total employment for biofuels may amount to 123,000 to 223,000. For comparison, Charles et al. 2013 state that the number of EU jobs at biofuels facilities alone amounted to 3,630 in total in 2011 (2,502 for biodiesel and 1,128 for bioethanol) but around 120,000 in total along the whole value chain (50,000 for biodiesel and 70,000 for bioethanol). Given the high uncertainty of both our estimation as well as the one presented by Charles et al. 2013, both results lie in the same range.
Regarding feedstocks for material uses in the chemical industry, employment in agriculture would be the same per tonne of feedstock as for biofuels. This results in an employment in agriculture of about 30,000 to 60,000.
- Conclusions
The following Table 1 shows the overall comparison of employment for biofuels and chemicals. Where we presented ranges in the above paragraphs, we assume average values here. The last two columns show that employment based on the same amount of biomass input is about 8 times higher for bio-based chemicals compared to biofuels if only the manufacturing stage is taken into account. If additionally the agricultural production is considered, this factor decreases because employment in agriculture per tonne of biomass is the same for both sectors. Still, employment per 1 million tonnes of biomass is about twice as high for chemicals than for biofuels.
Table 1: Overall comparison of employment in EU-28, year 2011
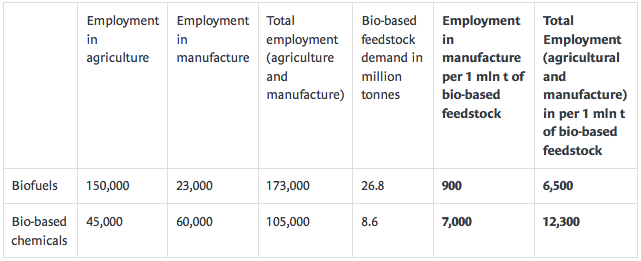
Figures 4a and 4b compare graphically the employment in both sectors. The upper part of the figure highlights that employment in agriculture has a much higher share in biofuels than in bio-based chemicals.

Figure 4a: Total employment (agricultural and manufacture) in biofuels and bio-based chemicals in EU-28, year 2011 (source: nova 2015)

Figure 4b: Total employment (agricultural and manufacture) in biofuels and bio-based chemicals in EU-28, year 2011 per 1 million tonnes of bio-based feedstocks (source: nova 2015) (source: nova 2015)
References
CEFIC 2014: Personal communication.
Charles, C., Gerasimchuk, I., Bridle, R., Moerenhout, T., Asmelas, E. and Laan, T. 2013: Biofuels—At What Cost? A review of costs and benefits of EU biofuel policies, Research Report, April 2013.
EBB (European Biodiesel Board) 2015: 2011 production by country, http://www.ebb-eu.org/stats.php.
Eurostat 2013a: Economic Accounts for Agriculture, http://ec.europa.eu/eurostat/cache/metadata/en/aact_esms.htm.
Eurostat 2013b: Structural Business Statistics – Reference Metadata in Euro SDMX Metadata Structure (ESMS), http://epp.eurostat.ec.europa.eu/cache/ITY_SDDS/en/sbs_esms.htm.
Eurostat 2013c: LFS series – Detailed annual survey results, http://ec.europa.eu/eurostat/cache/metadata/en/lfsa_esms.htm.
Eurostat 2013d: Forestry (for), http://ec.europa.eu/eurostat/cache/metadata/en/for_esms.htm.
FADN 2013: Cereals Report 2013.
Piotrowski, S., Essel, R., Carus, M., Dammer, L., Engel, L. 2015: Sustainable biomass potential for biofuels in competition to food, feed, bioenergy and industrial material use in Germany, Europe and worldwide (yet unpublished).
The Fiber Year 2014: The Fiber Year 2014 – World Survey on Textiles & Nonwovens.

Source
Supplier
European Biodiesel Board (EBB)
European Chemical Industry Council (CEFIC)
European Parliament
European Union
Eurostat
Farm Accountancy Data Network - FADN
Il Bioeconomista
nova-Institut GmbH
The Fiber Year GmbH
Share
Renewable Carbon News – Daily Newsletter
Subscribe to our daily email newsletter – the world's leading newsletter on renewable materials and chemicals