Highlights
- Overall, 67.0% of packaging waste generated in the EU was recycled in 2024. Belgium, Czechia, Italy, Slovenia, Netherlands, and Spain recycled more than 70% of packaging waste, the target to be reached by 2030.
- In Finland, reusable packaging put on the market for the first time amounted to 37.6 kg per inhabitant in 2024, the highest among the EU countries. Czechia (34.2), Poland (26.1) and Spain (25.9) also recorded more than 25 kg per inhabitant.
- On average, each person in the EU consumed 66 lightweight plastic carrier bags in 2024, a reduction of 29 bags since 2018. Lithuania (-148 bags per person), Sweden (-126), and Latvia (-124) recorded the largest reductions between 2018 and 2024.
This article presents recent statistics on packaging waste in the Member States of the European Union (EU) and in the EFTA countries. Information and data are based on Directive 94/62/EC (the Packaging Waste Directive), which lays down recycling and recovery targets, aiming at providing a high level of environmental protection and harmonising national measures concerning packaging and packaging waste. Furthermore, this article presents statistics on the consumption of lightweight plastic carrier bags based on Directive 2015/720 (the Plastic Bags Directive), which aims to reduce the consumption of plastic carrier bags in the EU countries.
Waste generation by packaging material
In 2024, 81.5 million tonnes of packaging waste were generated in the EU. The largest share of this was made up of paper and cardboard, amounting to 33.2 million tonnes. This corresponded to 40.8% of the total (see Figure 1). There were also substantial amounts of plastic packaging waste, at 16.2 million tonnes (19.9%), glass at 14.7 million tonnes (18.1%), and wood at 13.2 million tonnes (16.2%). The rest of the packaging waste was made up of 3.9 million tonnes of metal (4.9%) and 0.2 million tonnes of other materials (0.2%).
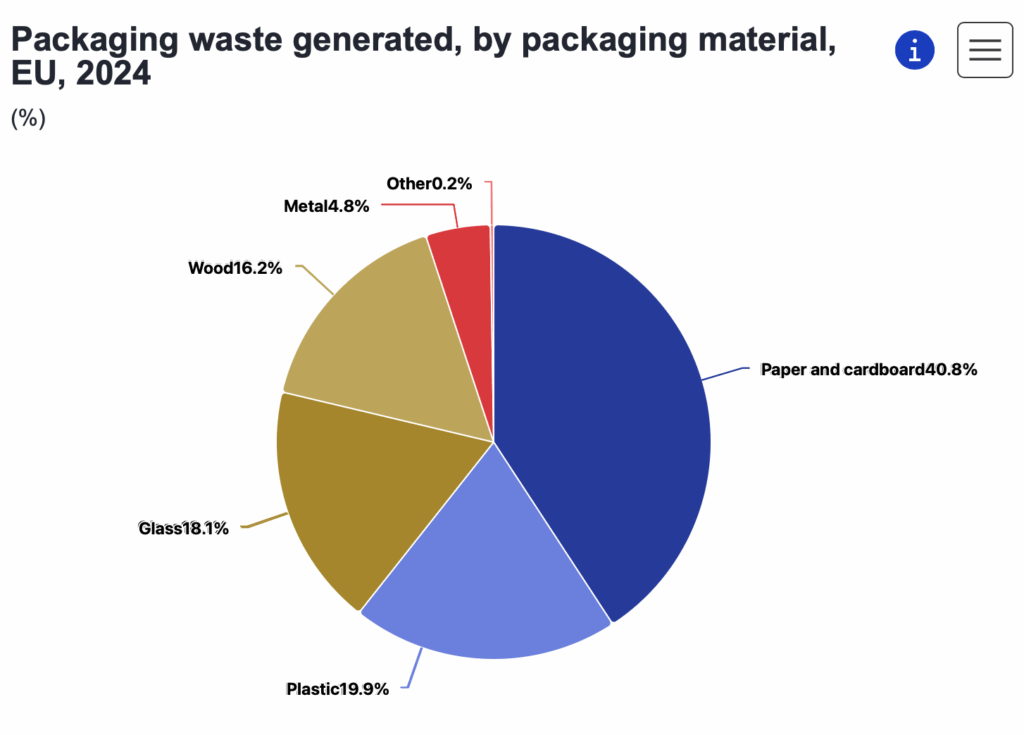
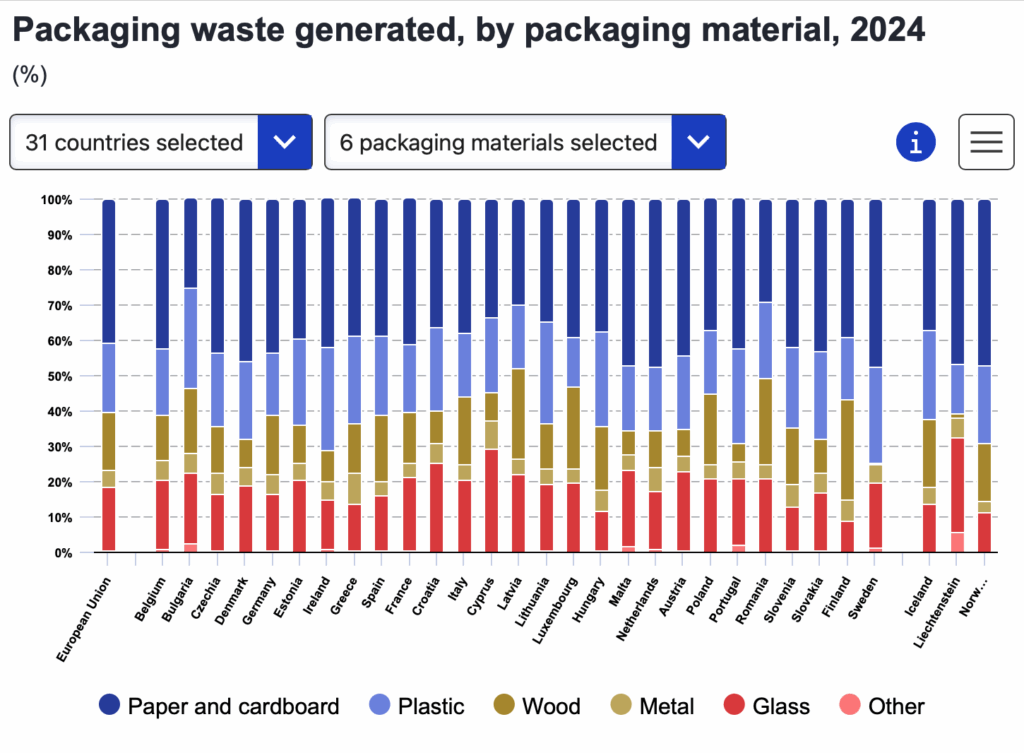
The packaging waste generated in the individual EU countries generally reflected the same distribution with respect to materials as the EU total. Figure 2 shows the shares of the different waste materials in the total packaging waste generated in each country.
In 26 of the 27 EU countries, paper and cardboard made up the largest share of the total packaging waste in 2024, in 13 of these countries with a share of more than 40% of the total. The only exception was Bulgaria (2022 data), where plastic packaging waste (28.4%) made up a slightly higher share than paper and cardboard (25.5%). Romania (29.3%; 2023 data), and Latvia (29.9%) were the only other EU countries where the share of paper and cardboard remained below 30%.
Plastic packaging and glass packaging also made up significant shares of the packaging waste across the EU countries. The share of plastic packaging waste in the total varied between 14.0% in Luxembourg and 29.4% in Ireland, while the share of glass ranged from an estimated 8.7% in Finland to 29.0% (provisional) in Cyprus.
In 2024, wooden packaging waste was the second largest category, after paper and cardboard, in 3 EU countries: Finland (28.6%; estimated), Latvia (25.5%), and Romania (24.5%; 2023 data). The share of metal was below 10% in all countries, with shares between 4.0% in Spain and an estimated 8.5% in Greece.
Development in packaging waste generated and recycled per inhabitant in the EU
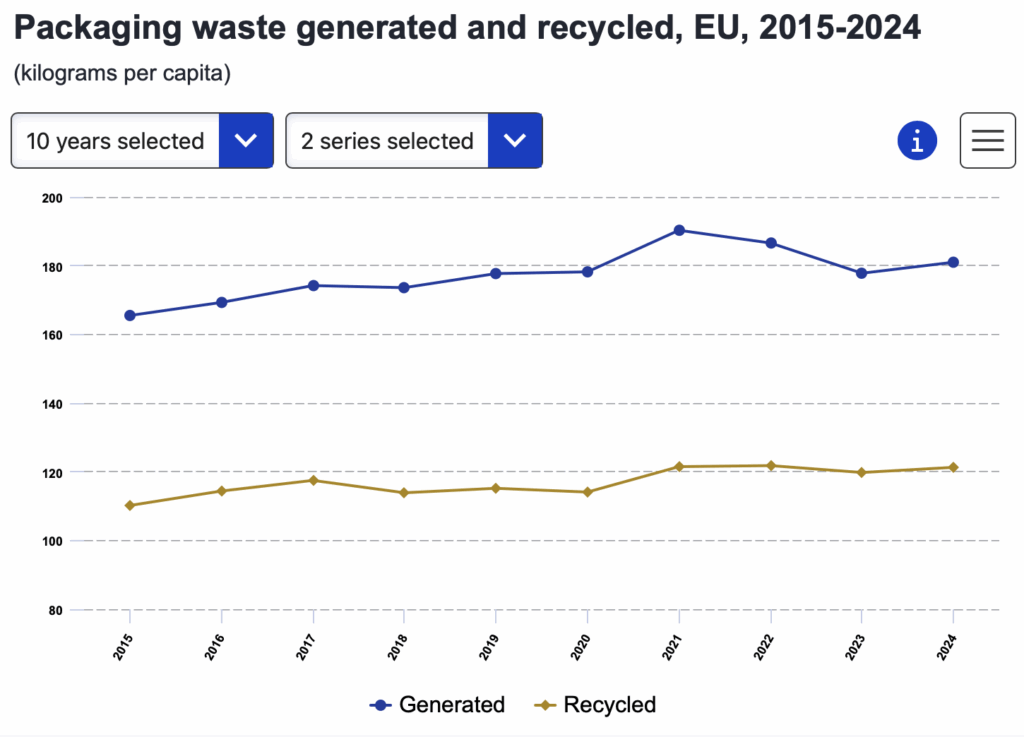
The total volumes of packaging waste generated and recycled comprise all packaging materials: paper and cardboard, plastic, glass, wood, metal and others. Figure 3 shows the development in the volume of packaging waste generated and recycled per inhabitant in the EU over the period 2015-2024.
From 2023 to 2024, the amount of packaging waste recycled increased moderately, by 1.3% to 121.3 kg per inhabitant. The highest level of recycled packaging waste was reached in 2022, at 121.8 kg per inhabitant. The amount of recycled waste per inhabitant generally followed an upwards trend 2015-2021, only interrupted by decreases in 2018 (-3.1%) and 2020 (-1.0%).
Generation and recycling of packaging waste in the EU countries
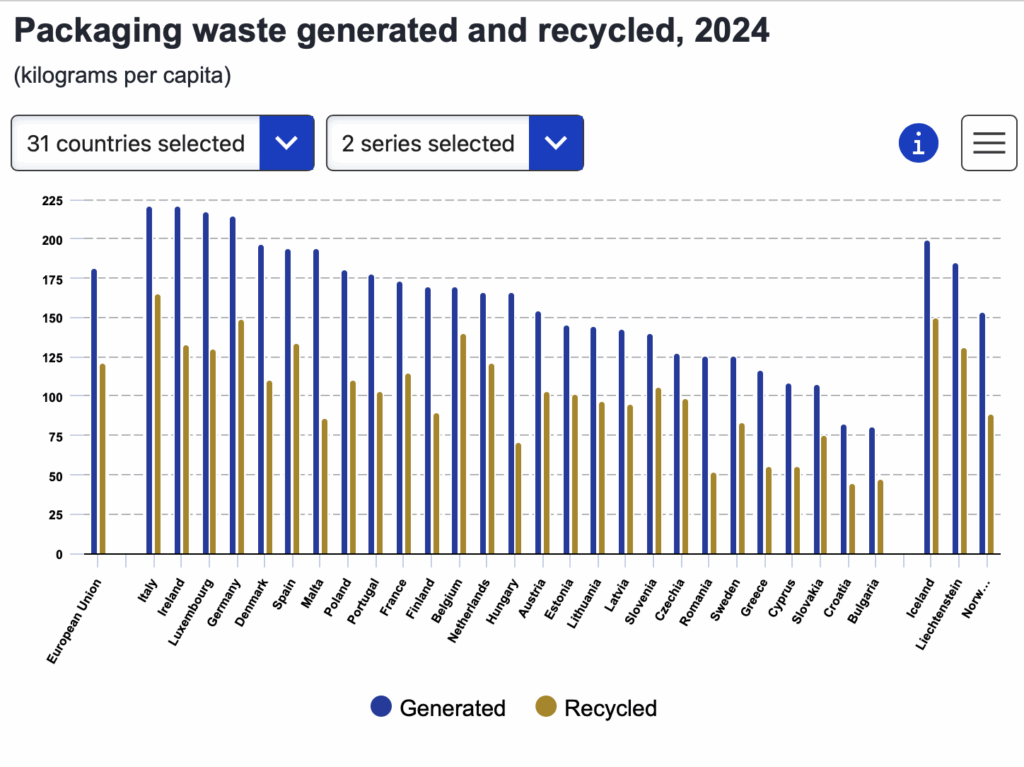
Figure 4 gives an overview of the data reported on generation and recycling of packaging waste per inhabitant by the EU and EFTA countries.
In 2024, the EU countries generated between 80.9 kg per inhabitant in Bulgaria (2022 data) and 221.2 kg per inhabitant in Italy. In 15 of the EU countries, 150 kg or more of packaging waste was generated per inhabitant. In addition to Italy, Ireland (220.9 kg per inhabitant), Luxembourg (217.0 kg), and Germany (214.7 kg) generated more than 200 kg per inhabitant. Less than 100 kg of packaging waste per inhabitant was generated in both Bulgaria (80.9 kg) and Croatia (82.1 kg).
In addition to both countries generating more than 200 kg of packaging waste per inhabitant, Italy and Germany also recycled the highest amounts of packaging waste per inhabitant among the EU countries. In 2024, Italy recycled 165.3 kg per inhabitant, followed by Germany with 149.0 kg per inhabitant. Belgium recycled 140.4 kg per inhabitant, the third highest amount.
The lowest amounts recycled per inhabitant were recorded by Croatia (44.4 kg), Bulgaria (47.2 kg; 2022 data), and Romania (51.5 kg; 2023 data). In the case of Bulgaria and Croatia, this reflected that they were the countries generating least packaging waste per inhabitant among the EU countries.
Recycling targets and rates for packaging waste
Article 6 of the Packaging Waste Directive sets out recycling targets for packaging waste. These are reconfirmed in Article 52 of the new Packaging and Packaging Waste Regulation. By 31 December 2030, a minimum of 70% of all packaging waste should be recycled. For packaging waste of different materials, the recycling targets to be reached as a minimum by 2030, are: 85% for paper and cardboard; 75% for glass; 55% for plastics; 80% for ferrous metals; 60% for aluminium and 30% for wood.
These targets are calculated according to weight, by dividing the amount of packaging waste recycled by the total amount of packaging waste generated.
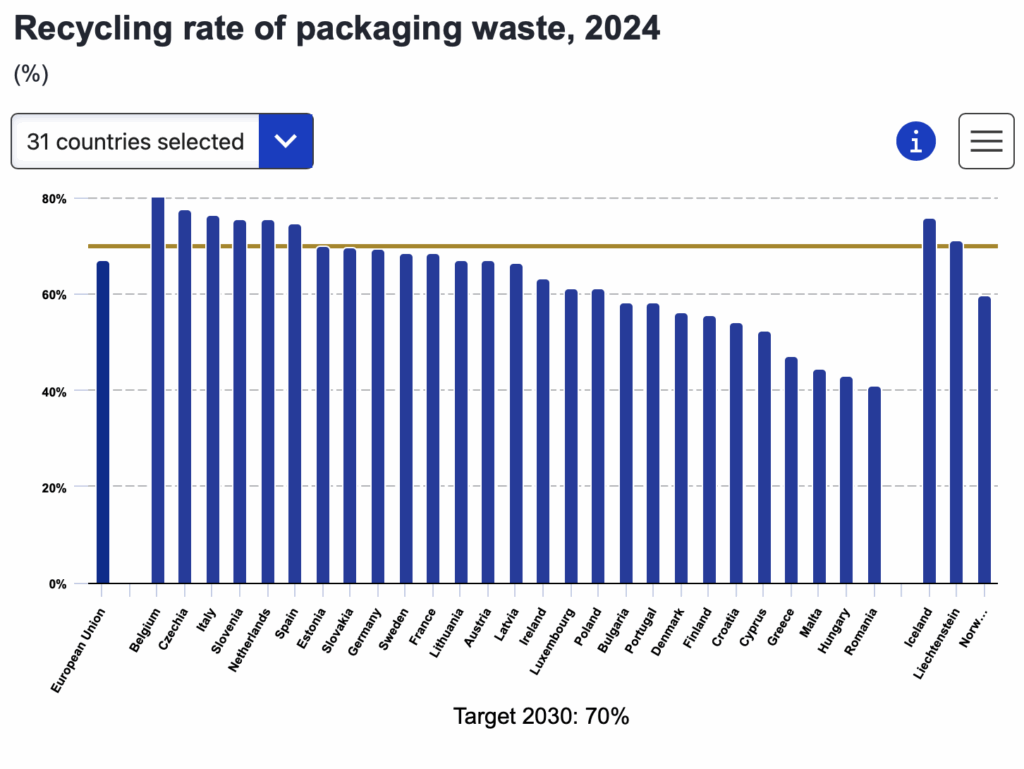
Figure 5 shows the recycling rate of total packaging waste for the EU and EFTA countries. In 2024, the EU was already close to meeting the 2030 target of 70%, achieving an overall recycling rate of 67.0%.
In 2024, 6 of the EU countries already met the 2030 overall recycling target for packaging waste: Belgium (83.2%), Czechia (77.5%; provisional), Italy (76.4%), Slovenia (75.6%), Netherlands (75.4%), and Spain (74.6%). A further 11 countries were closing in on the 70% target with recycling rates above 60%. Most notably, Estonia, Slovakia, Germany, Sweden (2023 data), and France reported recycling rates between 68.4% and 69.9%.
At the other end of the scale, 4 countries reported overall packaging recycling rates of less than 50% in 2024. These were Romania (41.0%; 2023 data), Hungary (42.9%; 2022 data), Malta (44.5%), and Greece (47.1%; provisional).
Recycling of plastic packaging waste
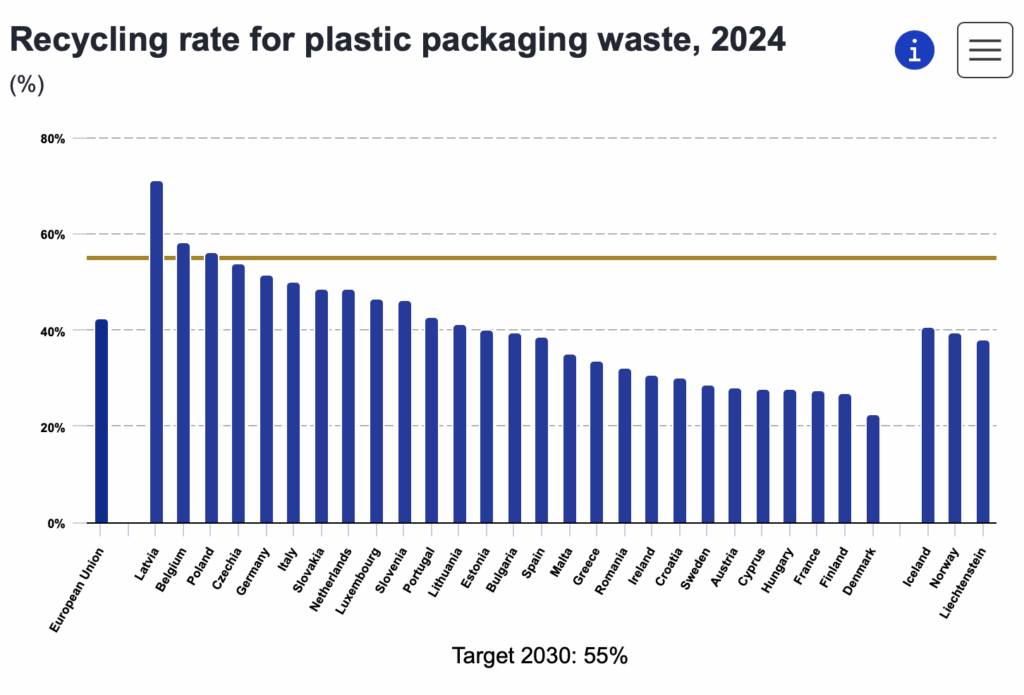
Figure 6 presents the recycling rate of plastic packaging waste in the EU and EFTA countries in 2024.
The Packaging Waste Directive sets out a target of minimum 55% of plastic packaging waste (by weight) being recycled by 2030. Latvia (71.0%), Belgium (58.2%), and Poland (56.0%; provisional) already achieved this target in 2024. Czechia (53.7%; provisional), Germany (51.3%), and Italy (50.1%) were also close to achieving it. Another 4 of the EU countries reported recycling rates of between 45% and 50% for plastic packaging waste.
The lowest recycling rates for plastic packaging waste were recorded by Denmark (22.5%), Finland (26.9%; provisional), France (27.4%), Hungary (27.6%; 2022 data), Cyprus (27.8%, provisional estimate), and Austria (27.9%). Sweden (2023 data) and Croatia also reported recycling rates for plastic packaging waste of less than 30% in 2024.
Reusable packaging
The Packaging Waste Directive (PPWD) obliges the EU countries to encourage increasing the share of reusable packaging placed on the market and of systems to reuse packaging in an environmentally sound manner. It also requires the EU countries to report data on reusable packaging to the European Commission for each calendar year. These provisions are reconfirmed by the Packaging and Packaging Waste Regulation (PPWR), which replaces the PPWD from 2026 on.
EU countries need to report data on reusable packaging since 2021. The data collection covers different aspects of reusable packaging, including all packaging and reusable packaging that are put on the market for the first time, as well as the number of ‘rotations’ that reusable packaging completes per year. A ‘rotation’ is defined as the cycle that reusable packaging accomplishes from the moment it is placed on the market together with the product it is intended to contain, to the moment it is ready to be re-used with another product. In addition to totals, the reported data includes a breakdown by main packaging materials. The data also differentiates between all packaging and sales packaging for delivery of goods to end users.
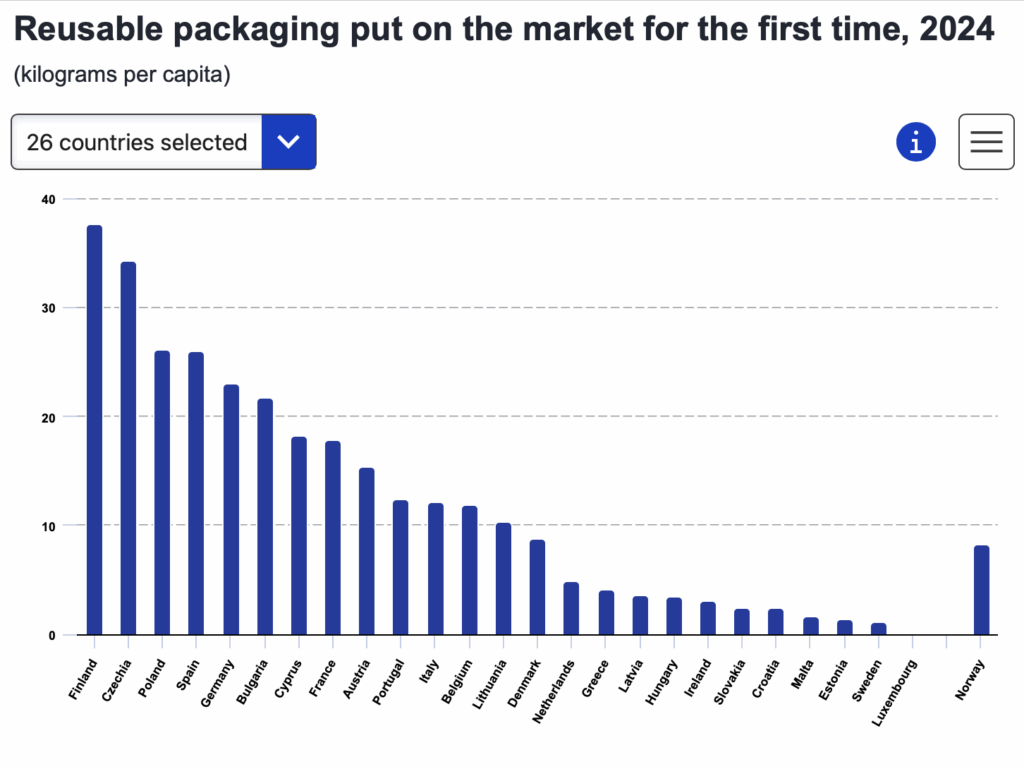
Figure 7 presents initial results on the volume of reusable packaging put on the market for the first time, measured in kilograms per inhabitant, based on data reported by EU and EFTA countries.
In 2024, Finland recorded the highest ratio among the EU countries of reusable packaging put on the market for the first time relative to the population, with 37.6 kg per capita. Czechia and Poland followed, with 34.2 and 26.1 kg per capita, respectively. Data for 2024 are provisional for all three countries. The other EU countries recording more than 20 kg per capita were Spain (25.9), Germany (23.0), and Bulgaria (21.7; 2022 data). In contrast, the lowest ratios were recorded by Malta (1.6 kg per capita), Estonia (1.4), Sweden (1.1; 2023 data), and Luxembourg (less than 0.05). Data are not available for Romania and Slovenia.
Consumption of plastic carrier bags
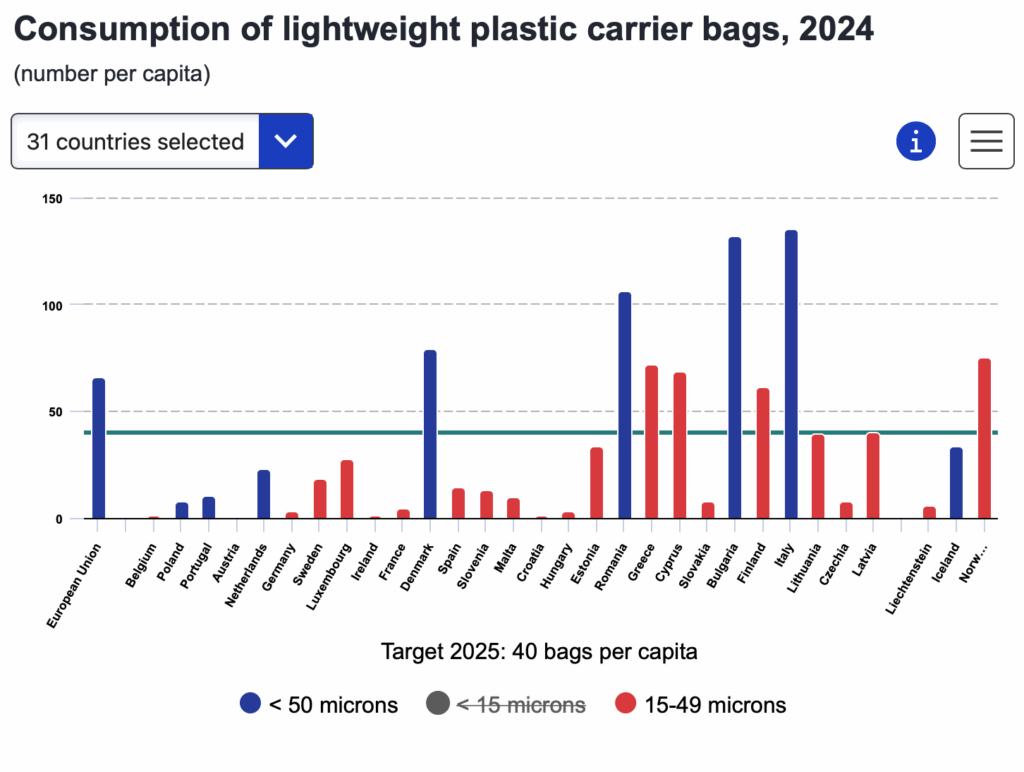
The Plastic Bags Directive (Directive 2015/720) aims at reducing the consumption of lightweight plastic carrier bags (LPCBs) in the EU. It sets out a target of less than 40 LPCBs per inhabitant being consumed, with this target to be achieved at the latest in 2025.
In 2024, 66 LPCBs were consumed per inhabitant in the EU (see Figure 8). This represented a modest increase in consumption compared with the previous year, when it stood at 64 LPCBs per inhabitant. The consumption of LPCBs had fallen in the EU each year from 2018, when it stood at 95 LPCBs per inhabitant, to 2023, reflecting the implementation of consumption reduction measures across the EU countries.
All EU countries have consumption reduction measures in place, as required by the Plastic Bags Directive. Nevertheless, consumption of LPCBs per inhabitant varies widely across the EU countries. This is primarily attributable to differences in the effectiveness of these measures. The differences in consumption also reflect that some countries have had measures in place longer than others, allowing more time for consumption patterns to change. In addition, there are certain differences in the data collection methodologies used by the different countries. It can thus not be ruled out that some of the differences between countries may be attributable to methodological issues in the data. However, data quality has improved year-on-year and is expected to improve further.
In 2024, the consumption ranged from 4 LPCBs per inhabitant in Belgium to 204 LPCBs in Latvia. In addition to Belgium, another 7 EU countries had already managed to reduce the consumption of LPCBs below the target of less than 40 LPCBs per inhabitant. These included Poland (8 LPCBs per inhabitant), Portugal (11 LPCBs), Austria (17 LPCBs), Netherlands (23 LPCBs), Germany and Sweden (both 27 LPCBs), and Luxembourg (31 LPCBs). Ireland and France, both with 44 LPCBs per inhabitant, were also closing in on the consumption target.
By contrast, Latvia (204 LPCBs) was the only EU country with a consumption of more than 200 LPCBs per inhabitant in 2024, although also Czechia (199 LPCBs) and Lithuania (173 LPCBs) recorded high consumption levels. Another 9 countries reported consumption of more than 100 LPCBs per inhabitant in 2024, in the range between 102 and 135 LPCBs per inhabitant.
EU countries are required to report the total number of LPCBs consumed in the country. Countries may also voluntarily provide more detailed data on consumption of very lightweight plastic carrier bags (VLPCBs), with a wall thickness of less than 15 microns, and LPCBs with a wall thickness of at least 15 but less than 50 microns. Among the 19 EU countries that provided such detailed data for 2024, the share of VLPCBs in total LPCB consumption ranged from 99.1% in Croatia to 10.2% in Luxembourg. Other EU countries with high shares of VLPCBs included Ireland (97.7%), Hungary (96.8%), Czechia (96.1%), and Slovakia (93.6%).
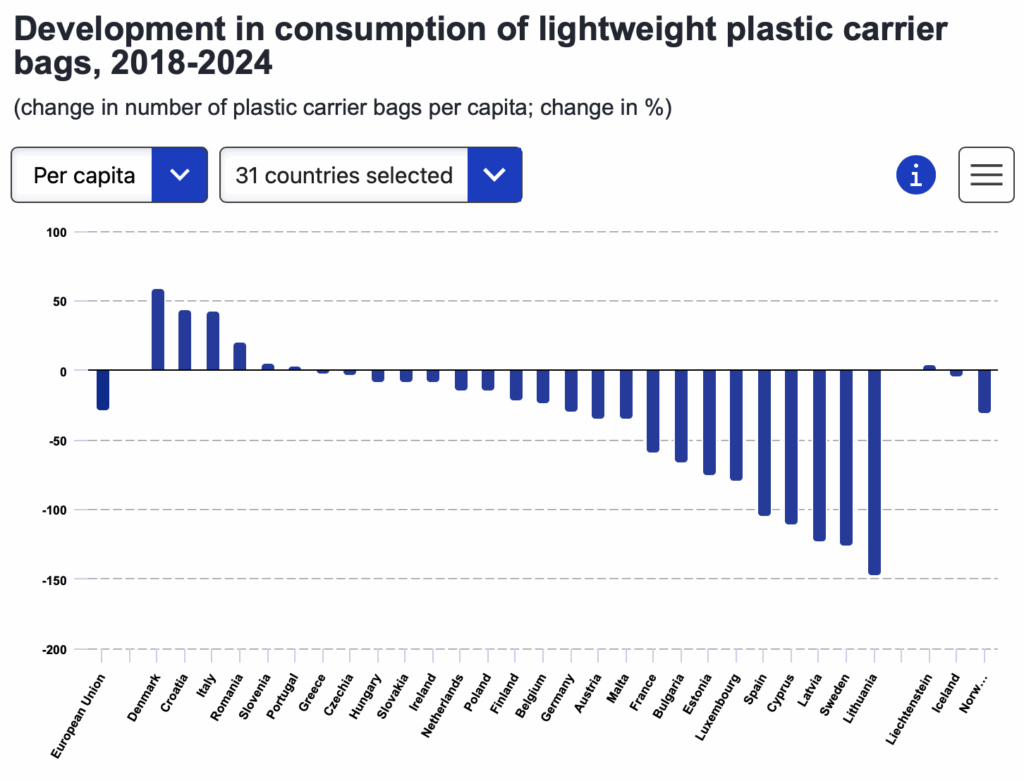
Over the period from 2018 to 2024, the largest reductions in consumption of LPCBs were achieved in Lithuania, with 148 LPCBs less consumed per inhabitant, Sweden (-126 LPCBs), Latvia (-124 LPCBs), Cyprus (-112 LPCBs; provisional), and Spain (-105 LPCBs). However, 6 of the EU countries recorded increases in the consumption of LPCBs over this period, most notably Denmark, with an increase of 59 LPCBs per inhabitant (change 2022-2024), Croatia (+44 LPCBs), and Italy (+42 LPCBs).
When looking at this development in relative terms, Belgium achieved the largest reduction in LPCB consumption per inhabitant over this period, with a decrease of -85%, closely followed by Sweden (-82%). Luxembourg (-69%), Poland (-68%; change 2019-2024), and Austria (-67%) also significantly reduced the consumption of LPCBs in their countries over this period.
Data sources
The packaging waste data are reported by the EU countries as laid down in Commission Decision 2005/270/EC and amended by Commission Implementing Decision 2019/665.
The data on lightweight plastic carrier bags are reported by countries as laid down in Commission Implementing Decision (EU) 2018/896. Countries commonly collect their data on consumption of lightweight plastic carrier bags from producers and importers or from retailers. The reported data are usually available in the Eurostat database on waste approximately 22 months after the end of the reference year.
Context
As a first legal basis, Council Directive 85/339/EEC of June 1985 required the establishment of national programs for the reduction in the volume of beverage containers disposed as waste in order to raise consumer awareness of the advantage of using refillable containers. The directive was repealed by the introduction of the Directive 94/62/EC on packaging and packaging waste (Packaging Waste Directive – PPWD). This directive aimed at harmonising national measures concerning the management of packaging and packaging waste and laid down measures aimed at preventing the production of packaging waste and at:
- reusing packaging;
- recycling; and
- implementing other forms of recovering packaging waste.
Directive 94/62/EC was amended in 2018 by Directive (EU) 2018/852. The data presented in this article are reported based on the amended Packaging Waste Directive.
With effect from 12 August 2026, Regulation (EU) 2025/40 on packaging and packaging waste (the Packaging and Packaging Waste Regulation ─ PPWR) repealed Directive 94/62/EC. Data from reference year 2026 onwards will be reported under the provisions of this new legal basis. The Packaging and Packaging Waste Regulation also amended Regulation (EU) 2019/1020 and Directive (EU) 2019/904. Amongst others, the Packaging and Packaging Waste Regulation lays down recycling targets for packaging waste and different materials contained in packaging waste, dates by which these targets should be achieved, rules for calculation of the achievement of the targets, as well as the reporting obligations of the EU countries.
The formats relating to the database system for packaging and packaging waste were defined in Commission Decision 2005/270/EC in 2005. This was further amended by Commission Implementing Decision 2019/665, which applies from reference year 2018.
Directive 2015/720 on reducing the consumption of lightweight plastic carrier bags is an amendment to the Packaging Waste Directive. It aims to reduce consumption of lightweight plastic carrier bags in order to combat littering, change consumer behaviour and promote waste prevention. This Directive was also repealed by the PPWR, with effect from 12 August 2026.
Definitions
Packaging is defined as any material that is used to contain, protect, handle, deliver or present goods. Packaging waste can arise from a wide range of sources including supermarkets, retail outlets, manufacturing industries, households, hotels, hospitals, restaurants and transport companies. Items like glass bottles, plastic containers, aluminium cans, food wrappers, timber pallets and drums are all classified as packaging.
Article 3 and Annex I of the Packaging Waste Directive specify ‘packaging’ in further detail.
The main packaging materials are glass, paper and cardboard, plastics, metals (aluminium and steel) and wood.
Composite materials are made of paper, plastic and metal which could not be separated by hand. Composites are reported under their predominant material by weight. Other packaging materials are counted as ‘others’.
Recovery includes recycling, energy recovery and other forms of recovery. Annex II of the Waste Framework Directive 2008/98/EC (consolidated version) defines energy recovery and other forms of recovery.
The weight of recovered or recycled packaging waste shall be the input of packaging waste to an effective recovery or recycling process. If the output of a sorting plant is sent to effective recycling or recovery processes without significant losses, it is acceptable to consider this output to be the weight of recovered or recycled packaging waste. The weight should exclude non-packaging materials as far as practical.
Reusable packaging is only counted once in its lifetime and not after every refilling and purchase trip.
The recycling rates are usually the total quantity of recycled materials divided by the total quantity of generated packaging waste. The data set ‘Recycling rates of packaging waste for monitoring compliance with policy targets, by type of packaging (env_waspacr)’ includes, for two types of waste material (plastic and wood), ‘Adjusted recycling rate’. That means the recycling rates adjusted for monitoring compliance with policy targets in accordance with Article 6 of Directive 94/62/EC and Article 6b(1) of Decision 2005/270. The relevant rates for those materials are:
- Recycling rate of plastic packaging waste counts exclusively material that is recycled back into plastic (material recycling / generation).
- Recycling rate of wooden packaging waste is calculated including repair (recycling + repair of wooden packaging waste / generation + repair of wooden packaging waste).
Commission Implementing Decision (EU) 2018/896 lays down the methodology for calculating the annual consumption of lightweight plastic carrier bags.
- Plastic carrier bags (PCBs) are defined as carrier bags, with or without handles, made of plastic, which are supplied to consumers at the point of sale of goods.
- Lightweight plastic carrier bags (LPCBs) are defined as plastic carrier bags with a wall thickness below 50 microns.
- Very lightweight plastic carrier bags (VLPCBs) are defined as plastic carrier bags with a wall thickness below 15 microns, which are required for hygiene purposes or provided as primary packaging for loose food when this helps to prevent food wastage.
Source
Eurostat, press release, 2026-10-13.
Supplier
EFTA countries (European Free Trade Association)
European Union
Eurostat
Share
Renewable Carbon News – Daily Newsletter
Subscribe to our daily email newsletter – the world's leading newsletter on renewable materials and chemicals