The new market and trend report “Bio-based Building Blocks and Polymers – Global Capacities, Production and Trends 2018-2023” from the German nova-Institute shows capacities and for the first time also production data for all bio-based polymers.
Deutsche Fassung: https://renewable-carbon.eu/news/2018-war-ein-sehr-gutes-jahr-fuer-bio-basierte-polymere-mehrere-zusaetzliche-kapazitaeten-wurden-in-betrieb-genommen/
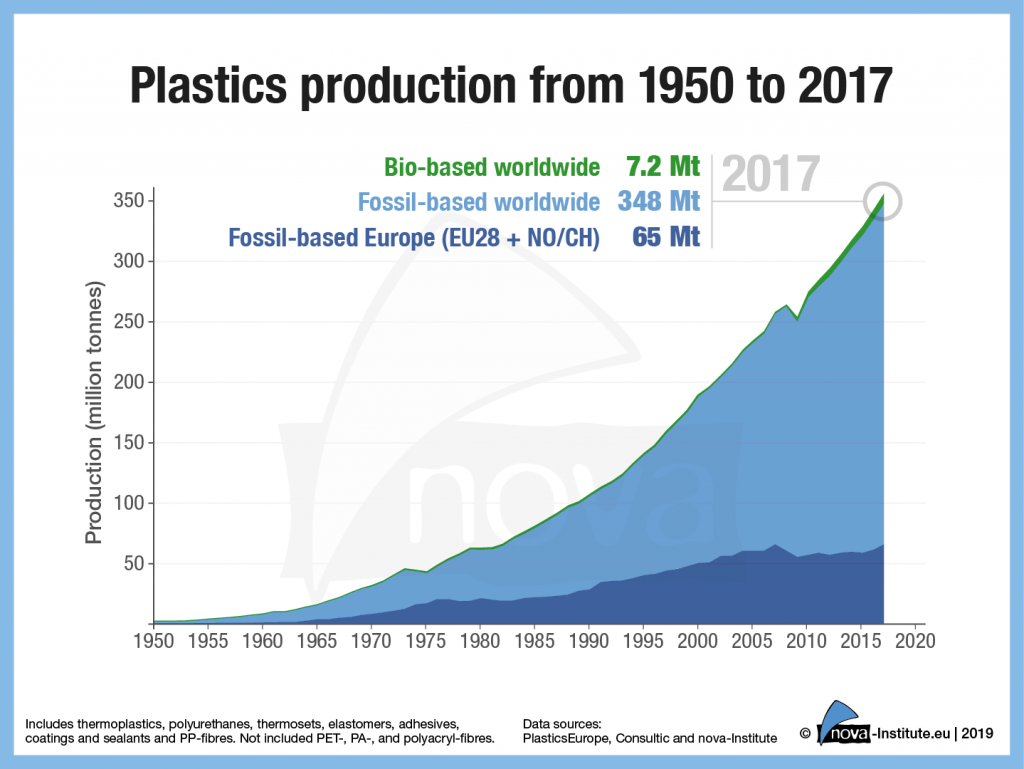
In 2018 the total production volume reached 7.5 million tonnes – these are already 2% of the production volume of petrochemical polymers. The potential is much higher, but is currently hampered by low oil prices and a lack of political support.
The production of bio-based polymers has become much more professional and differentiated in recent years. By now, there is a bio-based alternative for practically every application. The capacities and production of bio-based polymers will continue to grow with an expected CAGR of about 4% until 2023, almost at about the same rate as petrochemical polymers and plastics Therefore, the market share of bio-based polymers in the total polymer and plastics market remains constant at around 2% (Figure 1).
The increase in production capacity is mainly based on the expansion of the polylactic acid (PLA) production in Thailand and the polytrimethylene terephthalate (PTT) and starch blends production expansion in US. Especially PLA and starch blends will continue to grow significantly until 2023. Also new capacities of bio-based polyamides, polyethylene (PE) and, for the first time, polypropylene (PP) and poly(butylene adipate-co-terephthalate) (PBAT) will also be added in Europe in this period. The great hopeful polyethylene furanoate (PEF) will presumably only be able to offer commercial capacities after 2023. Overall, the market environment remains challenging with low crude oil prices and little political support.
So far, the two major advantages of bio-based polymers have not been politically rewarded. The first advantage is that bio-based polymers replace fossil carbon in the production process with renewable carbon from biomass. This is indispensable for a sustainable, climate-friendly plastics industry and is not yet politically rewarded.
The second advantage is offered by about a quarter of bio-based polymer production: They are biodegradable (depending on the environment) and can therefore be a solution for plastics that cannot be collected and enter the environment where they can biodegrade without leaving behind microplastics. Only a few countries such as Italy, France and, in future probably Spain will politically support this additional disposal path.
The most important market drivers in 2018 were brands that wanted to offer their customers environmentally friendly solutions and critical consumers looking for alternatives to petrochemicals. If bio-based polymers were to be accepted as a solution and promoted in a similar way as biofuels, annual growth rates of 10 to 20% could be expected. The same applies as soon as the price of oil rises significantly. Based on the already existing technical maturity of bio-based polymers, considerable market shares can then be gained.
The 380-pages market report is updated every year and the update for the year 2018 offers very special highlights: It contains comprehensive information on capacity development from 2018 to 2023, per bio-based building block and polymer and for the first time production data for the year 2018, per bio-based polymer.
A total of 17 bio-based building blocks and 16 polymers are covered in the report. In addition, the new issue includes analyses of market developments and producers per building block and polymer, so that readers can quickly gain an overview of developments that go far beyond capacity and production figures. For the first time, a detailed research, calculation and explanation of the market development of cellulose acetate (CA), bio-based epoxy resins and bio-based polyurethanes was made possible through a cooperation with the main experts in this area. The deep dive into the producing companies was comprehensively updated and shows now 175 detailed company profiles – from start-ups to multinational corporations.
Bio-based Polymers
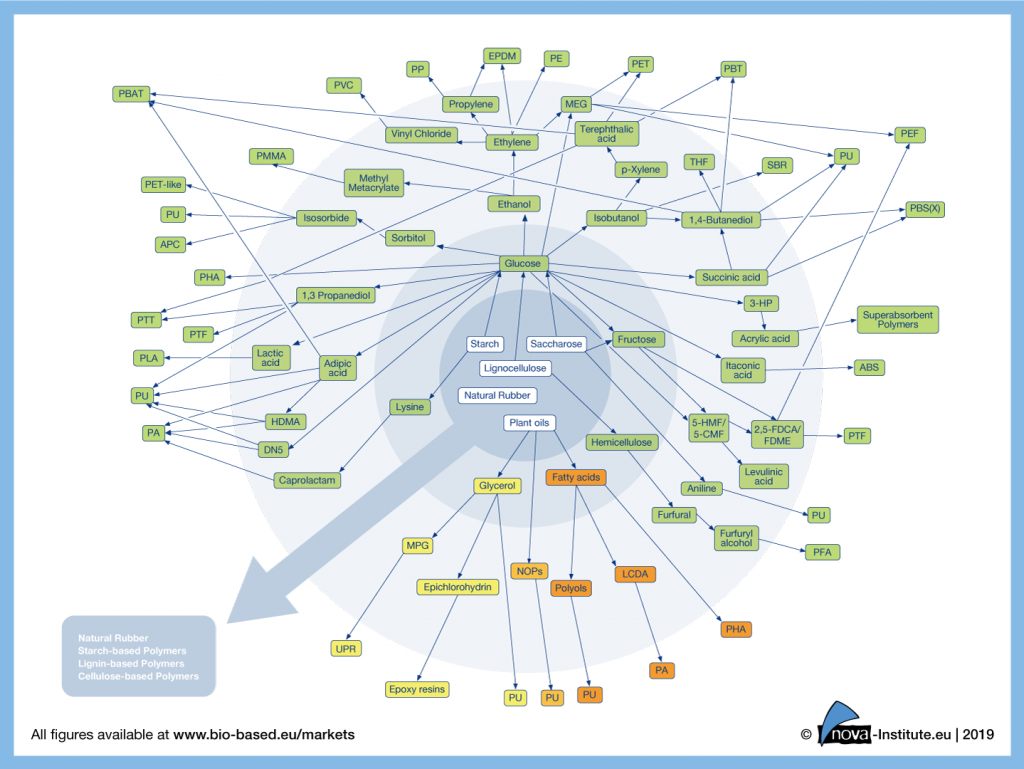
Figure 2 shows all commercially realized pathways from biomass via different building blocks and monomers to bio-based polymers. As in previous years, we have added several pathways and some new intermediates.
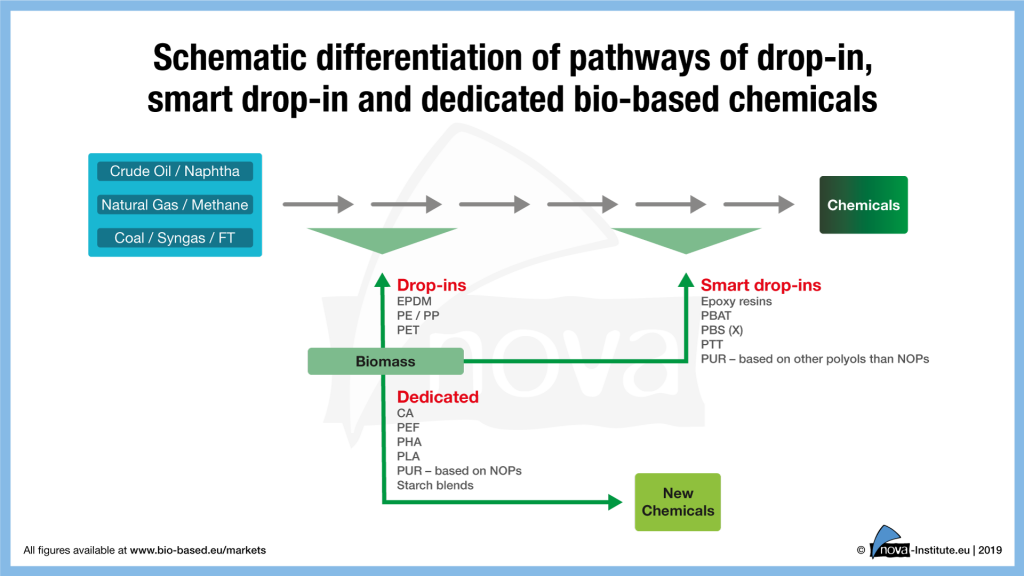
Figure 3 shows the different pathways of bio-based “drop-in”, “smart drop-in” and “dedicated” inputs within the chemical production chain. For each group certain bio-based polymers are exemplarily shown. The different bio-based polymer groups are subject to different market dynamics. While the drop-ins have direct petrochemical counterparts and can substitute them, the dedicated ones have new properties and functionalities that petrochemistry does not provide. Both have their own advantages and disadvantages from a production and market perspective.
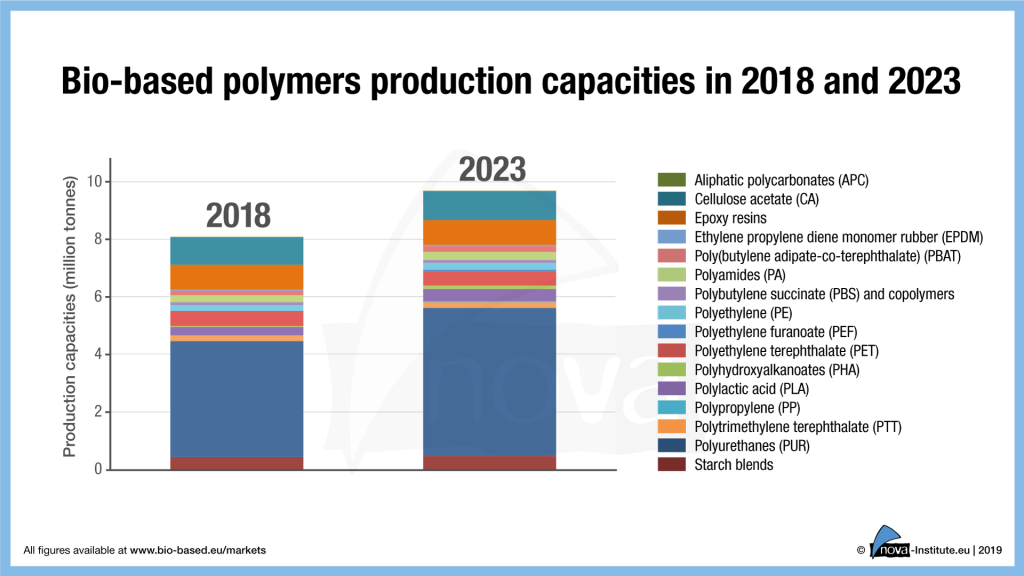
Figure 4 summarises the results of the 380-pages report and shows the development of capacities from 2018 to 2023 on the basis of forecasts by current and some additional producers. Here an increase is shown from 8 Mio. tonnes production capacity in 2018 to 9.6 Mio. tonnes in 2023, which means an expected yearly growth rate of about 4% (CAGR). With an expected CAGR of 10% between 2018 and 2023, Europe will display the highest growth of bio-based polymer capacities compared to other regions of the world (see Figure 7).
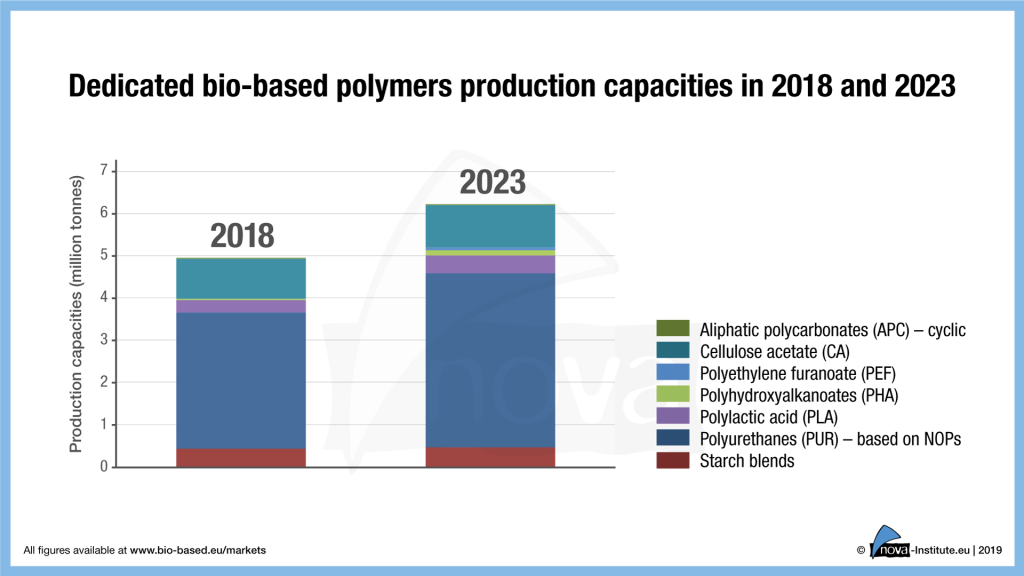
If only the new dedicated polymers (for definition see Figure 3) are considered, the growth rates are expected to be even higher (CAGR = 5%), as Figure 5 shows. In the group of dedicated bio-based polymers, price pressure stemming from cheap crude oil is lower than for other groups because there are no direct petrochemical counterparts.
Bio-based Building Blocks
Figure 6 illustrates the development of capacities for the main bio-based building blocks, the core of the new bioeconomy, used for the production of polymers. Between 2018 and 2023, the CAGR of 4.5% will be only slightly higher than that of bio-based polymers (4%) as a whole. The building blocks can be used in structural polymers as well as in functional polymers (for definition see below) and also in various other applications such as food, feed, cosmetics or pharmaceuticals.
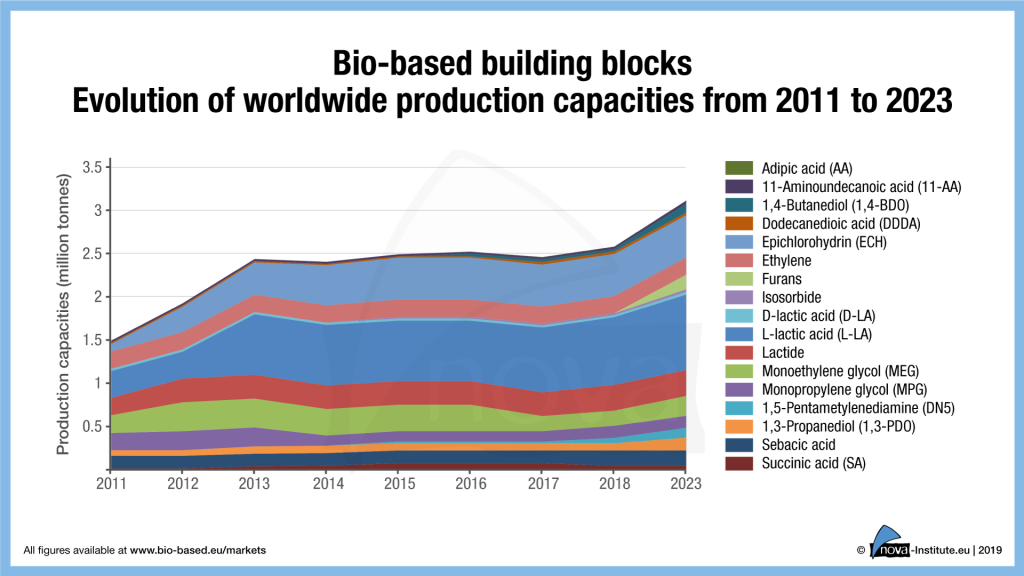
The overall production capacity of bio-based building blocks increased about 5% (120,000 t/a) in 2018, although some pioneers went bankrupt. The overall forecast for bio-based building blocks evolution worldwide indicates a total growth by 4.5% until 2023 with 1,3-propanediol (1,3-PDO), 1,4-butanediol (1,4-BDO), 1,5-pentamethylenediamine (DN5) and 2,5-furandicarboxylic acid (2,5-FDCA) / furan dicarboxylic methyl ester (FDME) being the main drivers.
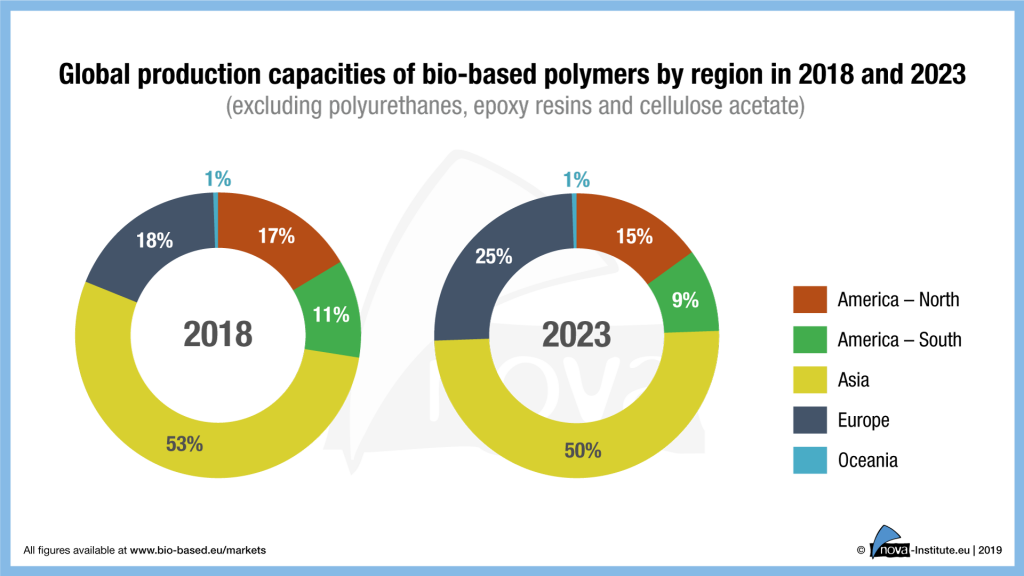
Global production capacities of bio-based polymers by region
Besides the leading Asian region which has installed the largest bio-based production capacities worldwide with 53% in 2018, Europe follows with 18% and North and South America with 17% respectively 11%. In the next five years, the share of Europe will rise to 25% until 2023 – all other regions will face decreasing shares (see Figure 7).
This increase is mainly due to the dedicated bio-based polymers PEF, PHA, PLA and starch blends as well as the new established bio-based production capacity of PP, the increase in PE capacity and an increase in polyamides and PBAT.
This shows that the substantial investment in research and development in Europe is bearing fruit. Now, if the political framework were designed more favourably, the bioeconomy in Europe could really flourish. Technology and business are ready.
Market segments for bio-based polymers
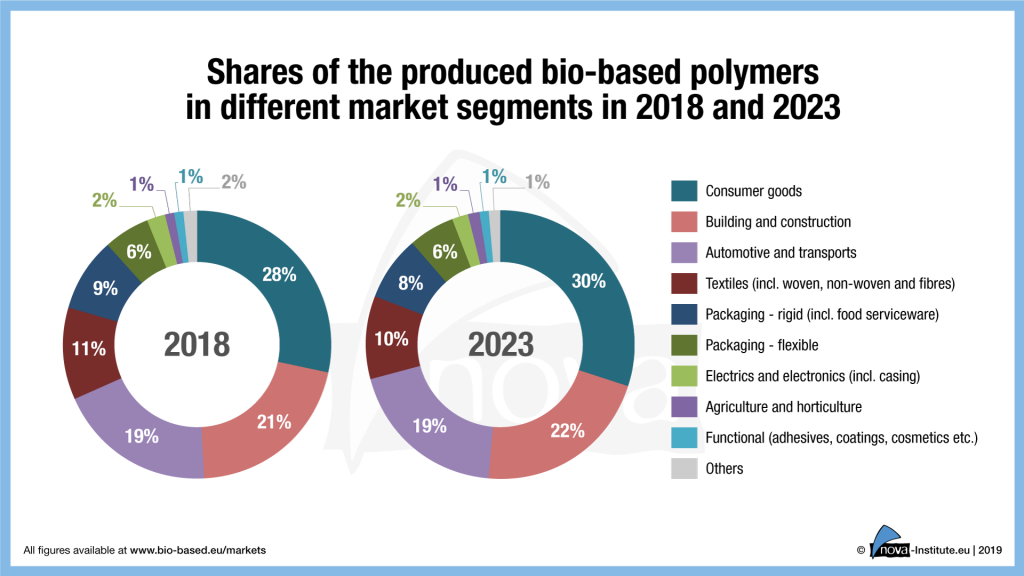
Today, bio-based polymers can be used in almost all market segments and applications, but the applications per polymer are very different. Figure 8 shows a summary of the applications for all polymers.
Consumer goods make up the largest share of actually produced bio-based polymers with 28% in 2018 (mainly PUR, epoxy resins and PA), followed by the building and construction sector (epoxy resins, PA, PUR) with 21%, the automotive and transport sector with 19% (epoxy resins, PA, PUR) and the packaging (flexible and rigid) (PLA, PBAT, PE, PET, starch blends) with 15%, as well as textiles (wovens and non-wovens) (CA, PA, PLA, PTT) with 11%. For 2023, no significant changes are expected with regard to market application shares.
The market and trend report is written by the international biopolymer expert group headed by the nova Institute. The authors come from Asia, North America and Europe. The report is now available for 3,000 € at www.bio-based.eu/reports – in addition to further market studies on different topics of bio- and CO2-based economics.
The data published annually by European Bioplastics (www.european-bioplastics.org/market/) are taken from the market report of the nova-Institut, but with a reduced selection of bio-based polymers.
Michael Carus, CEO of nova-Institute: “The market and trend report of the international nova biopolymer expert group on bio-based building blocks and polymers is outstanding. The update 2018 has more in-depth information than ever, on all commercially available bio-based polymers, capacities, production, applications and outlook. It also includes detailed information on the producers.”
Download Graphics and short version of the study at http://bio-based.eu/markets/#PolymerData2019
Press release as PDF file: 19-02-11_PR_biopolymer_data_report_2019
Source
nova-Institut GmbH, press release, 2019-02-11.
Supplier
European Bioplastics e.V.
nova-Institut GmbH
Share
Renewable Carbon News – Daily Newsletter
Subscribe to our daily email newsletter – the world's leading newsletter on renewable materials and chemicals