Showing 141–160 of 215
-
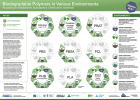
Biodegradable Polymers in Various Environments According to Established Standards and Certification Schemes – Graphic (PDF, Version 2021)
Sustainability & Health, Technology
1 Page
3358 Downloads
-
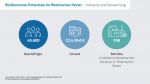
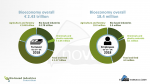
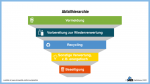
Bioökonomie-Potenziale im Rheinischen Revier – Industrie und Verwertung (JPG)
Markets & Economy, Technology
1 Page
33 Downloads
-
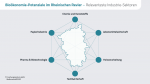
Bioökonomie-Potenziale im Rheinischen Revier – Relevanteste Industriesektoren (JPG)
Markets & Economy, Technology
1 Page
32 Downloads -
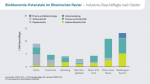
Bioökonomie-Potenziale im Rheinischen Revier – Industriebeschäftige nach Sektor (JPG)
Markets & Economy, Technology
1 Page
50 Downloads -
-
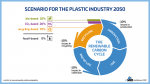
Scenario for the Plastic Industry 2050 (PNG)
Markets & Economy, Policy, Sustainability & Health, Technology
1 Page
1564 Downloads -
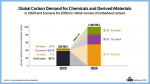
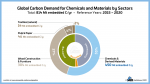
Global Carbon Demand for Chemicals and Derived Materials (PNG)
Markets & Economy, Policy, Sustainability & Health, Technology
1 Page
1380 Downloads -
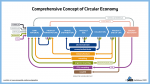
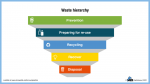
Comprehensive Concept of a Circular Economy (PNG)
Policy, Sustainability & Health
1 Page
964 Downloads -
-
Global Carbon Demand for Chemicals and Materials by Sectors (PDF)
Sustainability & Health
1 Page
550 Downloads -
Global Carbon Demand for Chemicals and Materials by Sectors (PNG)
Sustainability & Health
1 Page
362 Downloads -
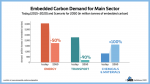
Embedded Carbon Demand for Main Sector – Today and 2050 (PNG)
Sustainability & Health
1 Page
206 Downloads -
Embedded Carbon Demand for Main Sector – Today and 2050 (PDF)
Sustainability & Health
1 Page
246 Downloads -
-
-
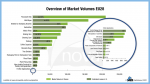
BioSinn Applications – Overview of Market Volumes in the EU28 (PNG)
Markets & Economy
1 Page
269 Downloads -
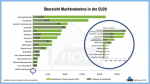
BioSinn Produkte / Anwendungen – Übersicht der Marktvolumina in der EU28 (PNG)
Markets & Economy
1 Page
162 Downloads -
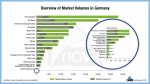
BioSinn Applications – Overview of Market Volumes in Germany (PNG)
Markets & Economy
1 Page
175 Downloads -
BioSinn Produkte / Anwendungen – Übersicht der Marktvolumina in Deutschland (PNG)
Markets & Economy
1 Page
192 Downloads -