Showing 61–80 of 215
-
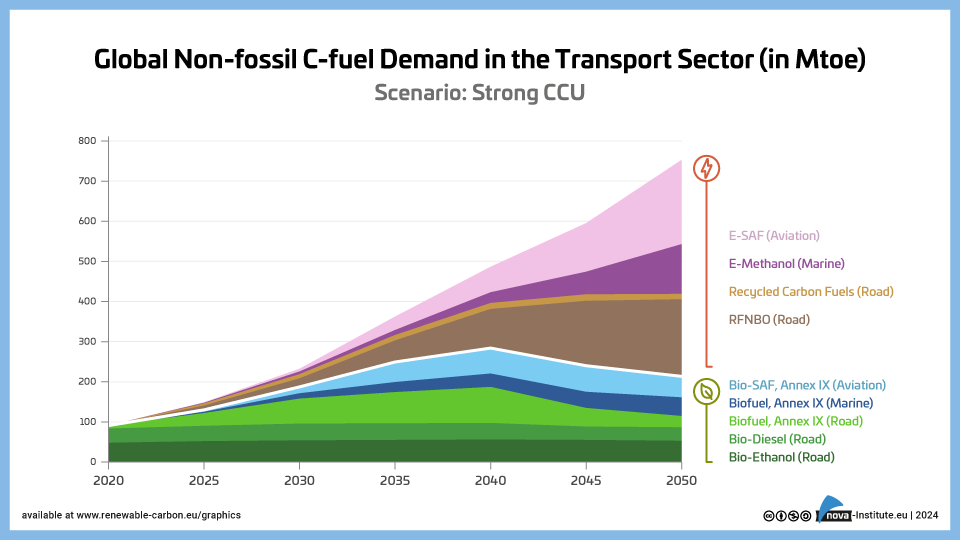
Global Non-fossil C-fuel Demand in the Transport Sector – Strong CCU – Graphic (PNG)
Markets & Economy, Policy, Sustainability & Health
1 Page
655 Downloads
-
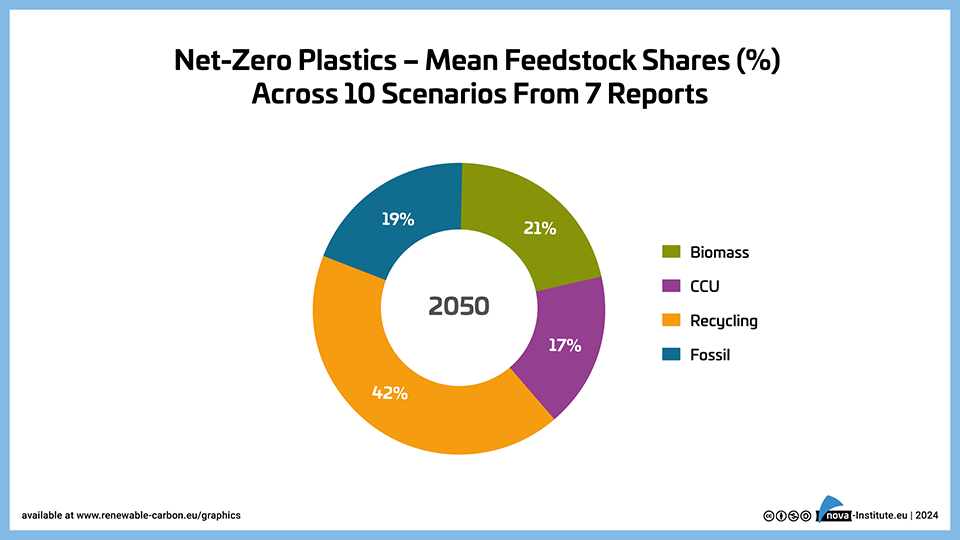
Net-Zero Plastics – Mean Feedstock Shares (%) Across 10 Scenarios From 7 Reports – Graphic (PNG)
Markets & Economy, Policy, Sustainability & Health
1 Page
92 Downloads -
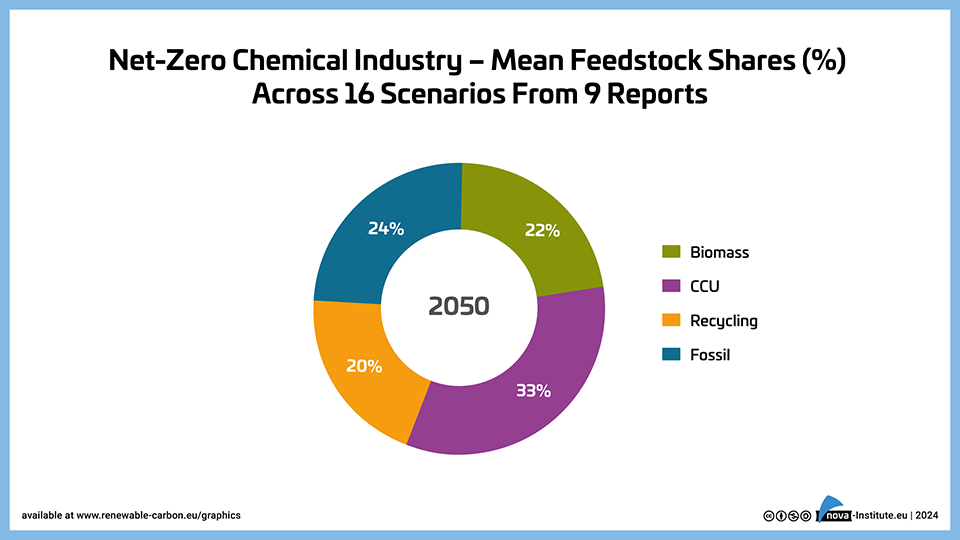
Net-Zero Chemical Industry – Mean Feedstock Shares (%) Across 16 Scenarios From 9 Reports – Graphic (PNG)
Markets & Economy, Policy, Sustainability & Health
1 Page
70 Downloads -
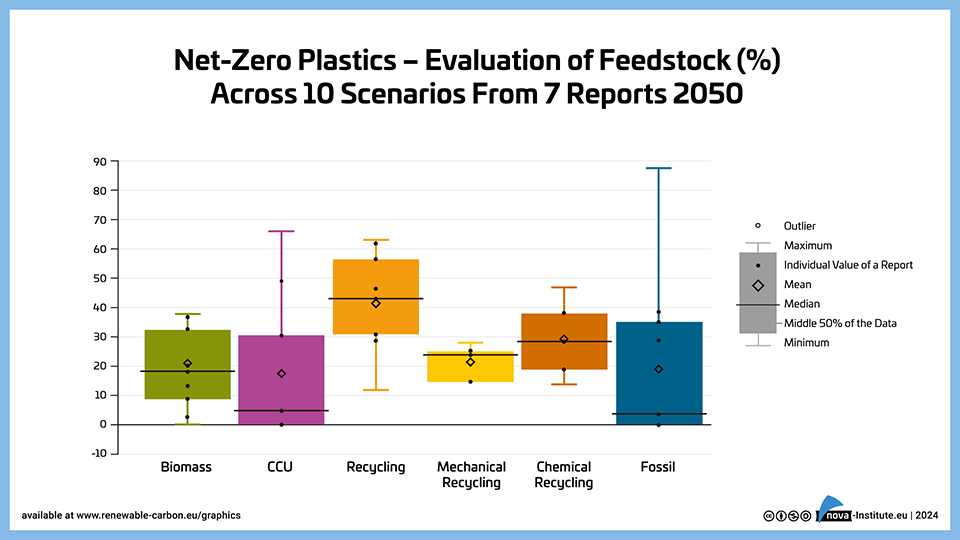
Net-Zero Plastics – Evaluation of Feedstock (%) Across 10 Scenarios from 7 Reports 2050 – Graphic (PNG)
Markets & Economy, Policy, Sustainability & Health
1 Page
127 Downloads -
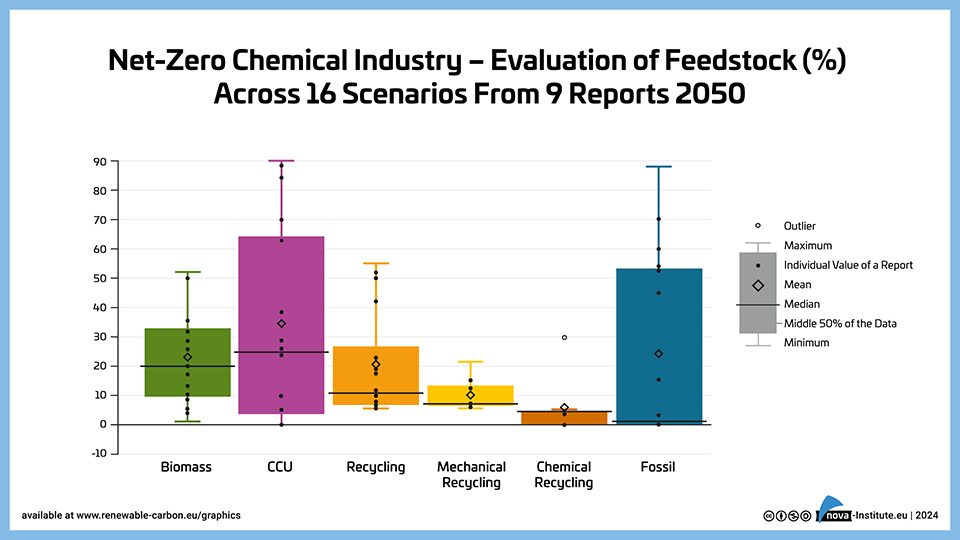
Net-Zero Chemical Industry – Evaluation of Feedstock (%) Across 16 Scenarios from 9 Reports 2050 – Graphic (PNG)
Markets & Economy, Policy, Sustainability & Health
1 Page
105 Downloads -
-
-
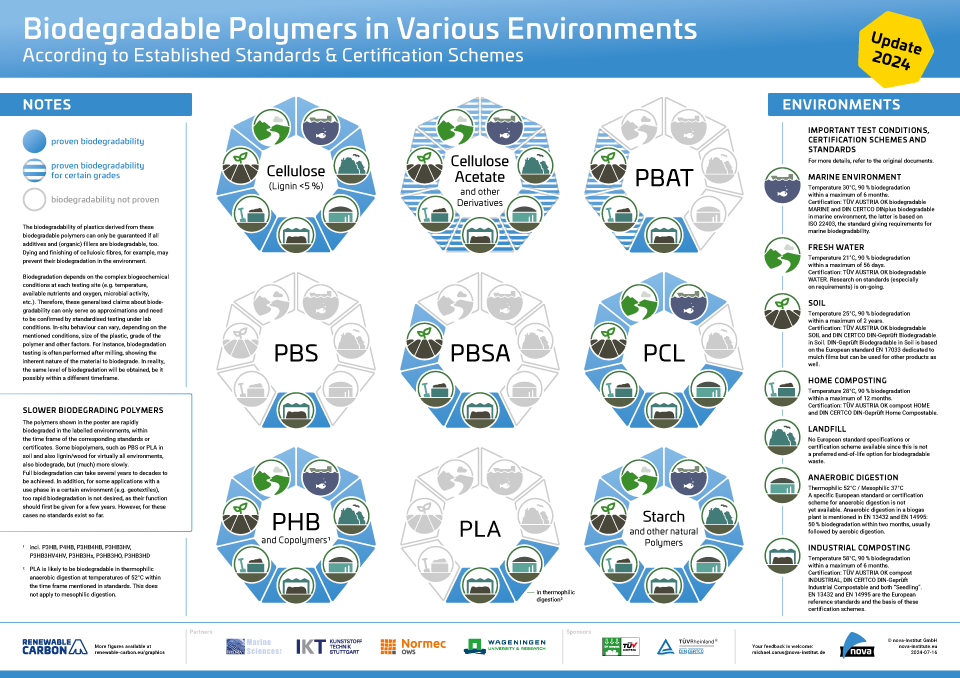
Biodegradable Polymers in Various Environments According to Established Standards and Certification Schemes – Graphic (PDF, current version)
Sustainability & Health
1 Page
1570 Downloads -
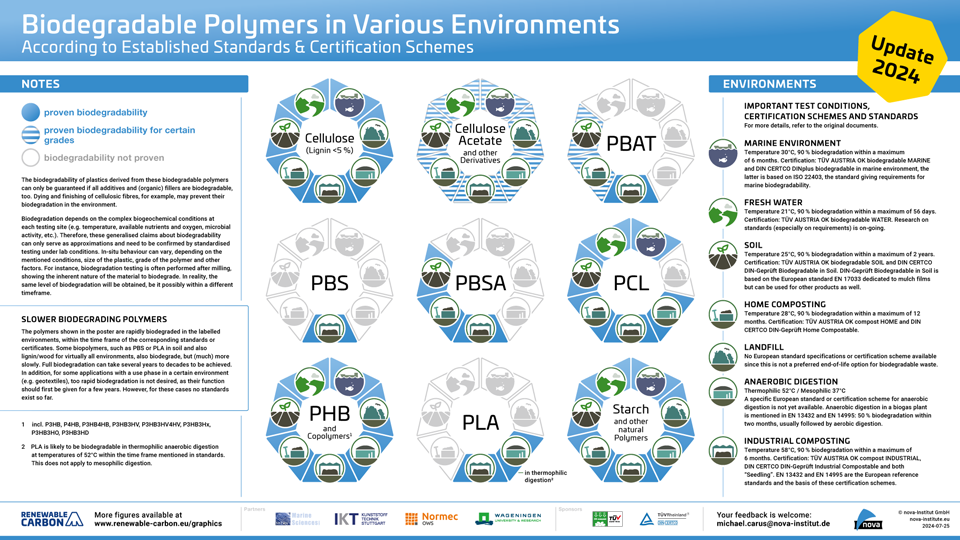
Biodegradable Polymers in Various Environments According to Established Standards and Certification Schemes – Graphic (PNG, current version)
Sustainability & Health
1 Page
728 Downloads -
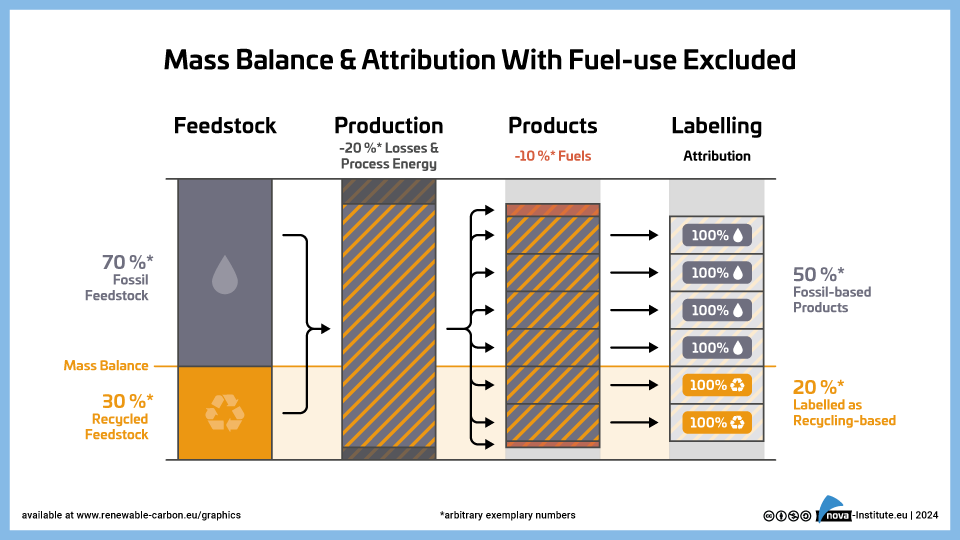
Mass Balance & Attribution With Fuel-use Excluded (PNG)
Markets & Economy, Policy, Sustainability & Health, Technology
1 Page
297 Downloads -
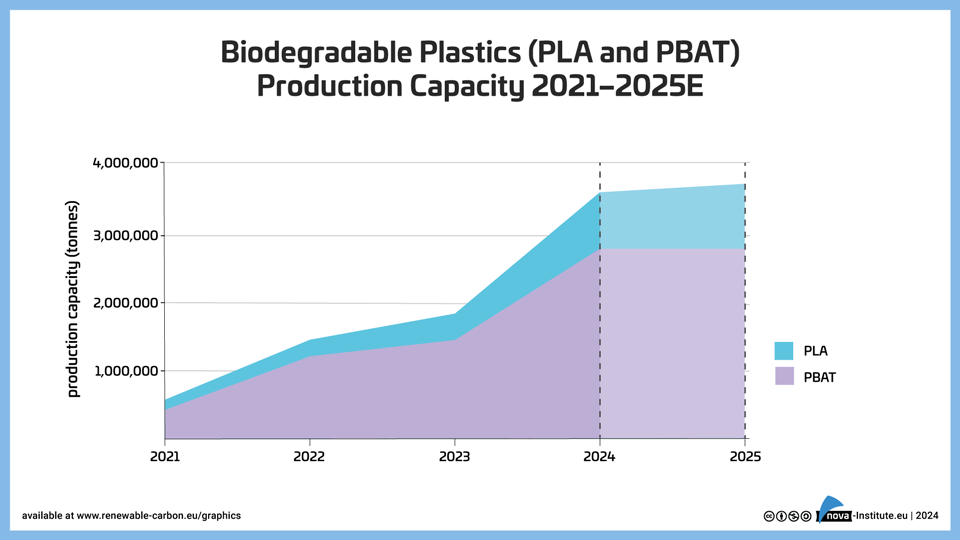
Biodegradable Plastics PLA and PBAT Production Capacity 2021-2025 – Graphic (PNG)
Markets & Economy, Policy, Sustainability & Health
1 Page
46 Downloads -
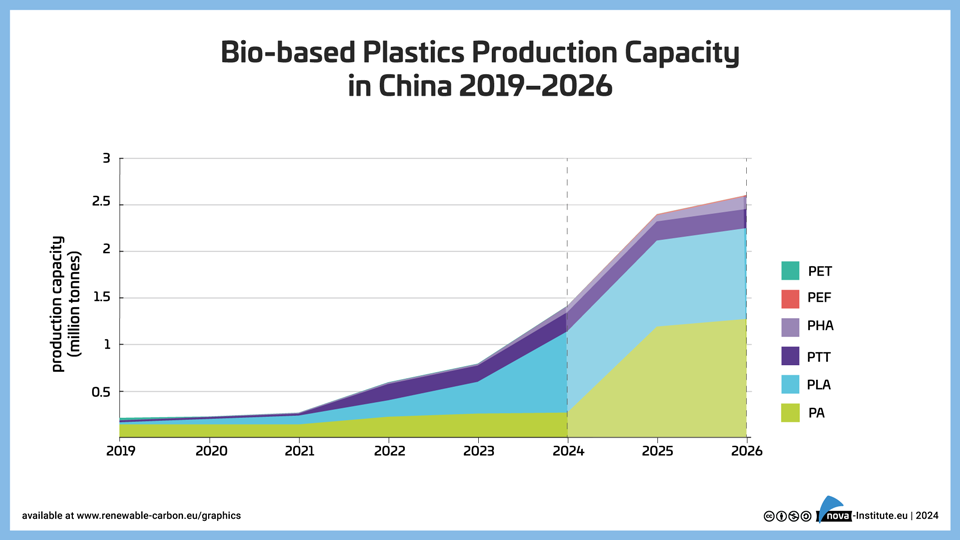
Bioplastics Production Capacity in China 2019–2026 – Graphic (PNG)
Markets & Economy, Policy, Sustainability & Health
1 Page
51 Downloads -
-
-
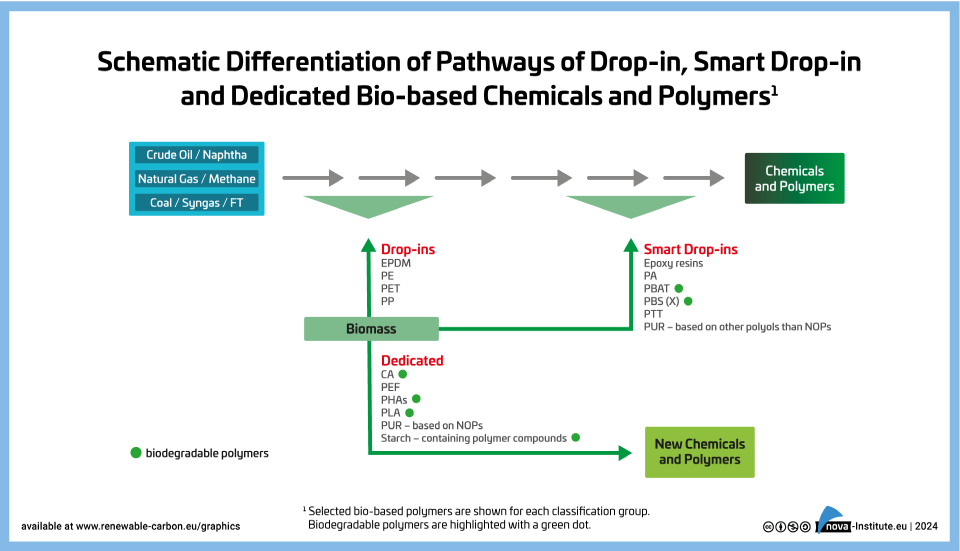
Schematic Differentiation of Pathways of Drop-in, Smart Drop-in and Dedicated Bio-based Chemicals and Polymers (PNG)
Markets & Economy
1 Page
223 Downloads
-
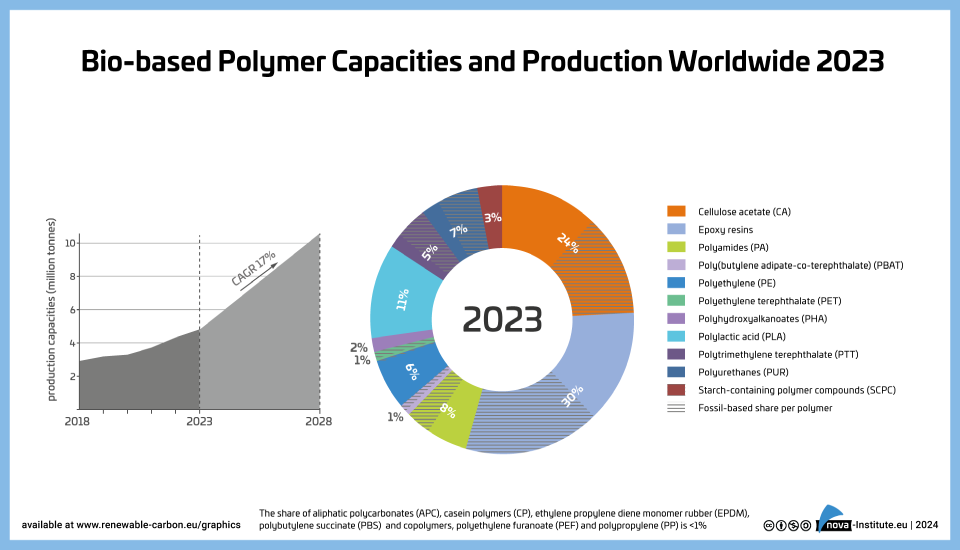
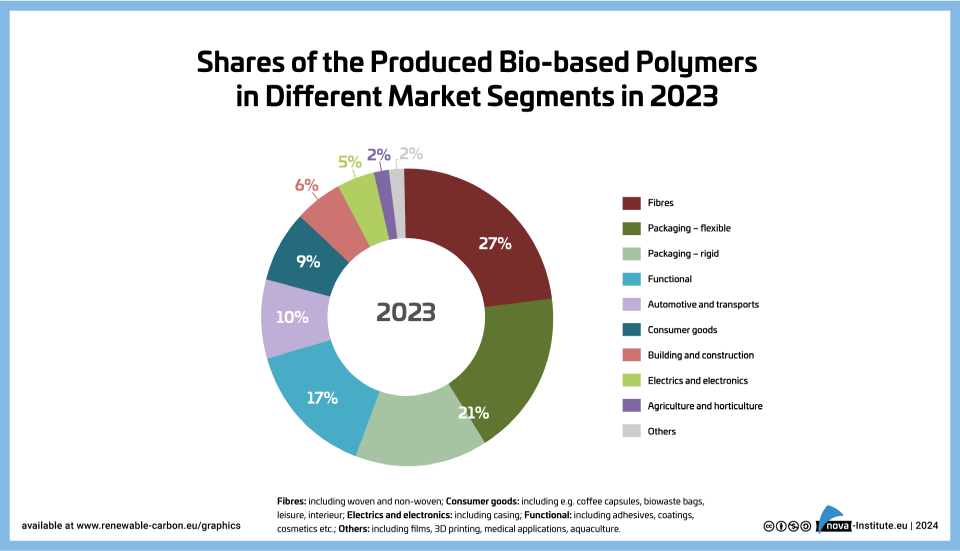
Shares of Produced bio-based polymers in different market segments (PNG)
Markets & Economy
1 Page
308 Downloads -
Bio-based Biodegradable Polymers Worldwide Production Capacities 2018-2028 (PNG)
Markets & Economy
1 Page
320 Downloads -
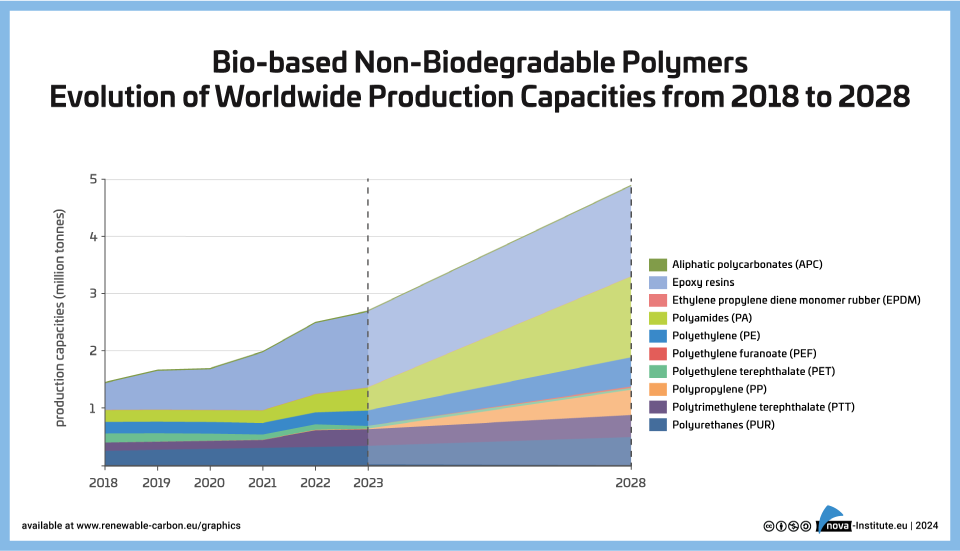
Bio-based Non-Biodegradable Polymers Evolution of Worldwide Production Capacities (PNG)
Markets & Economy
1 Page
185 Downloads -
-
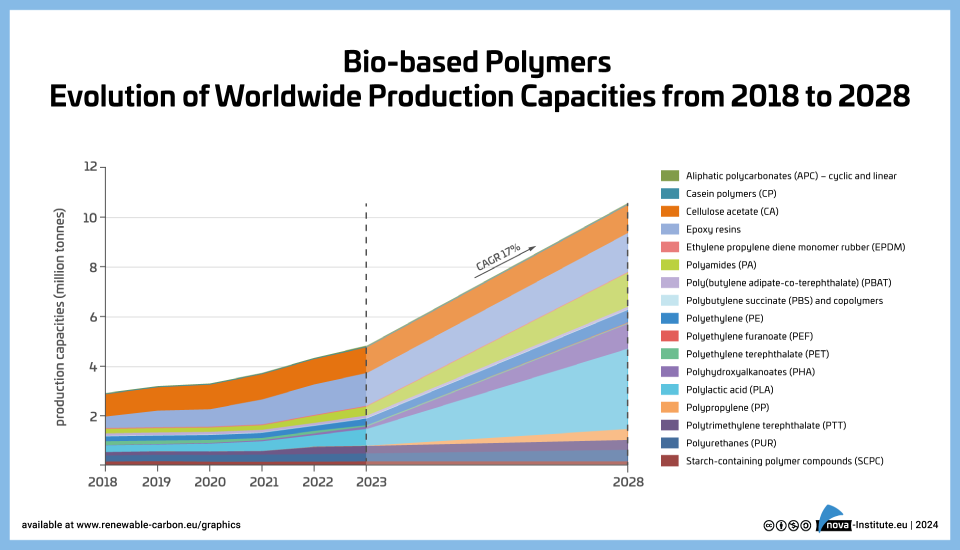
Bio-based Polymers – Evolution of worldwide production capacities from 2018 to 2028 (PNG)
Markets & Economy
1 Page
286 Downloads
![Bio-based Biodegradable Polymers Worldwide Production Capacities 2018-2028 (PNG) [Digital]](https://renewable-carbon.eu/publications/wp-content/uploads/2024/03/24-02-28-Bio-based-Biodegradable-Polymers-Worldwide-Production-Capacities-2018-2028_thumbnail.png)