Showing 41–60 of 219
-
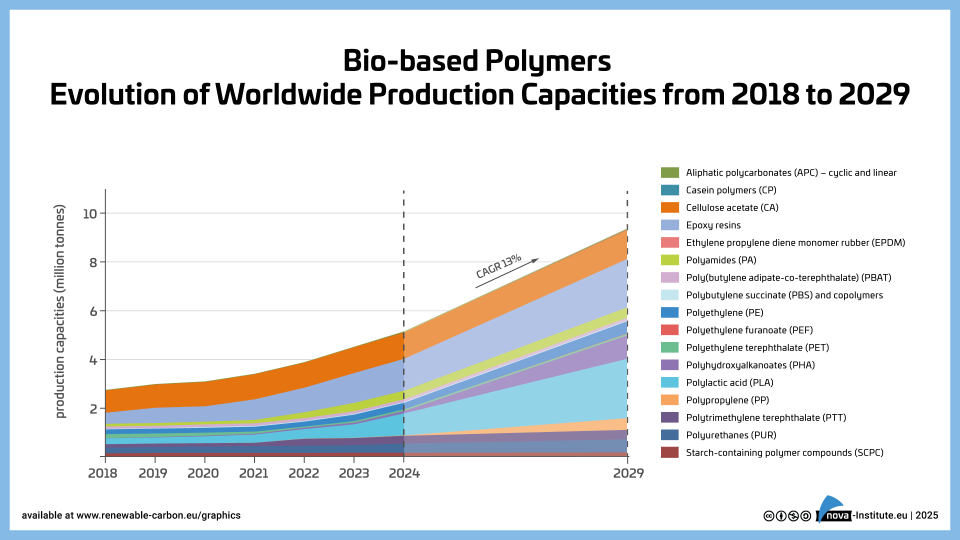
Bio-based polymers – Evolution of worldwide production capacities from 2018 to 2029 (PNG)
Markets & Economy
1 Page
121 Downloads
-
-
Core Elements of LCA for Renewable Carbon Solutions (PNG)
Policy, Sustainability & Health
1 Page
134 Downloads -
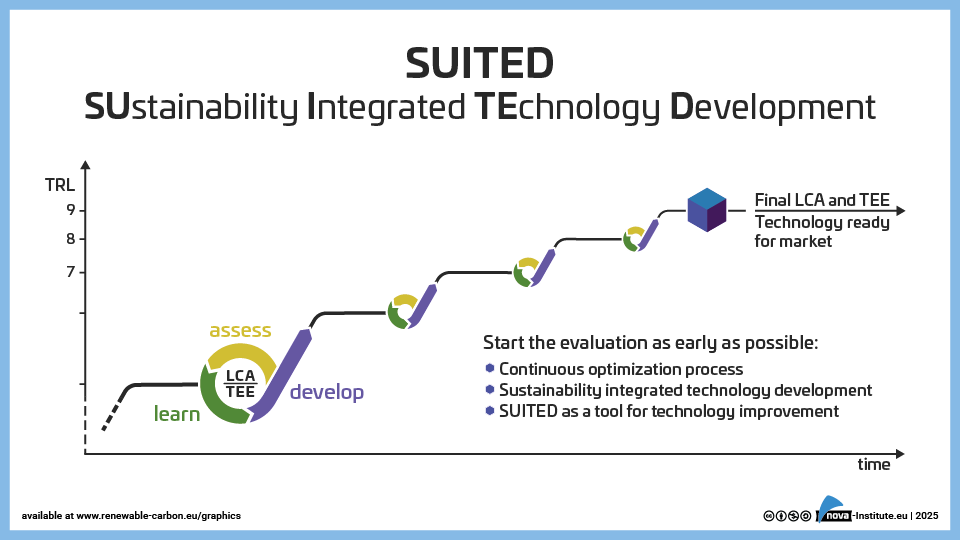
SUITED approach: SUstainable Integrated TEchnology Development (PNG)
Markets & Economy, Sustainability & Health
1 Page
27 Downloads -
Global Major Fibre Types by Production in % (PNG)
Markets & Economy, Sustainability & Health
1 Page
48 Downloads -
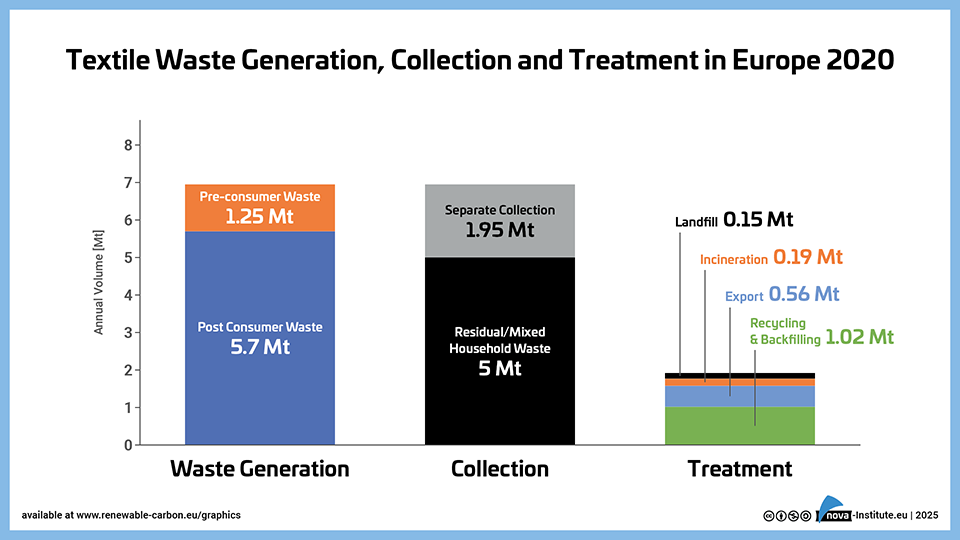
Textile-Waste-Generation-Collection-and-Treatment-in-Europe-2020 (PNG)
Markets & Economy, Sustainability & Health
1 Page
54 Downloads -
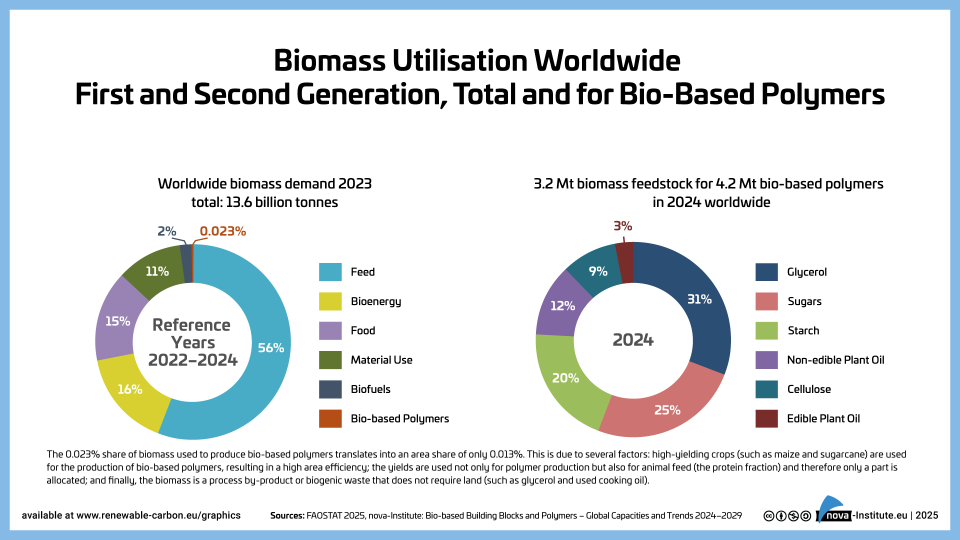
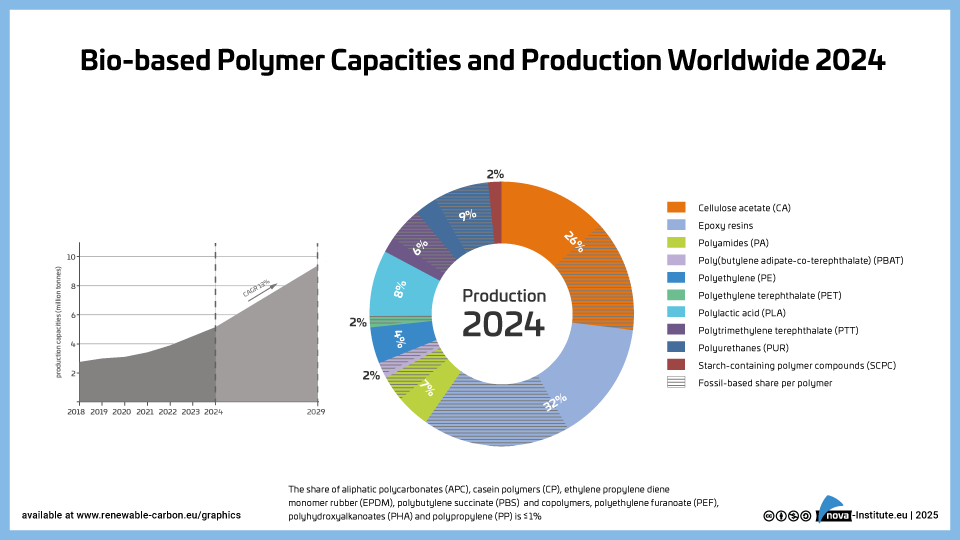
Bio-based-Polymer-Production-and-Bio-based-shares-2024 (PNG)
Markets & Economy, Policy, Sustainability & Health
1 Page
190 Downloads -
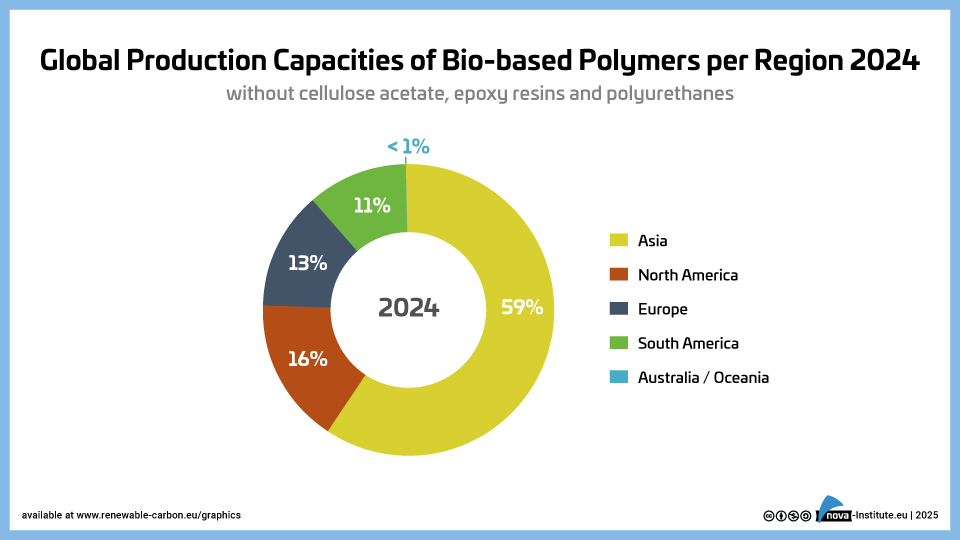
Global-Production-Capacities-of-Bio-based-Polymers-per-Region-2024 (PNG)
Markets & Economy, Policy, Sustainability & Health
1 Page
48 Downloads -
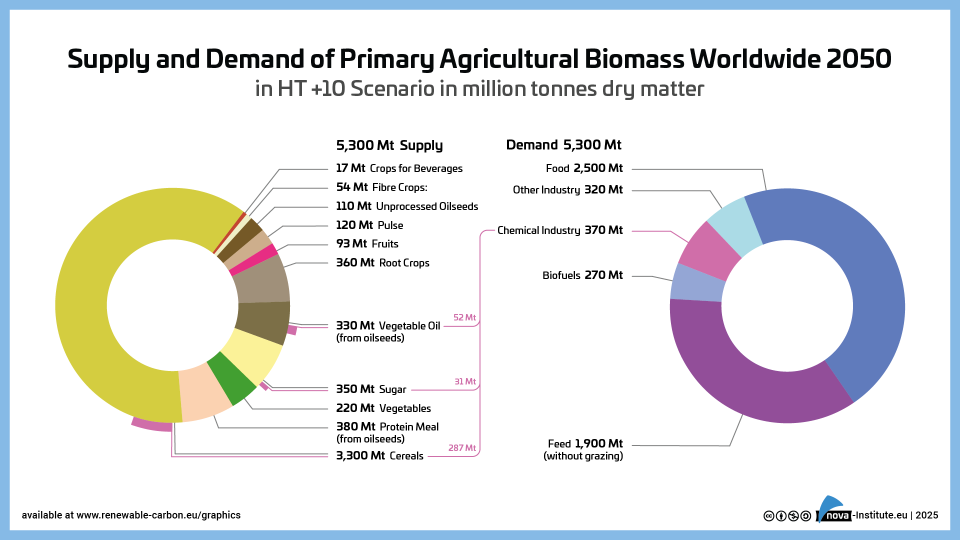
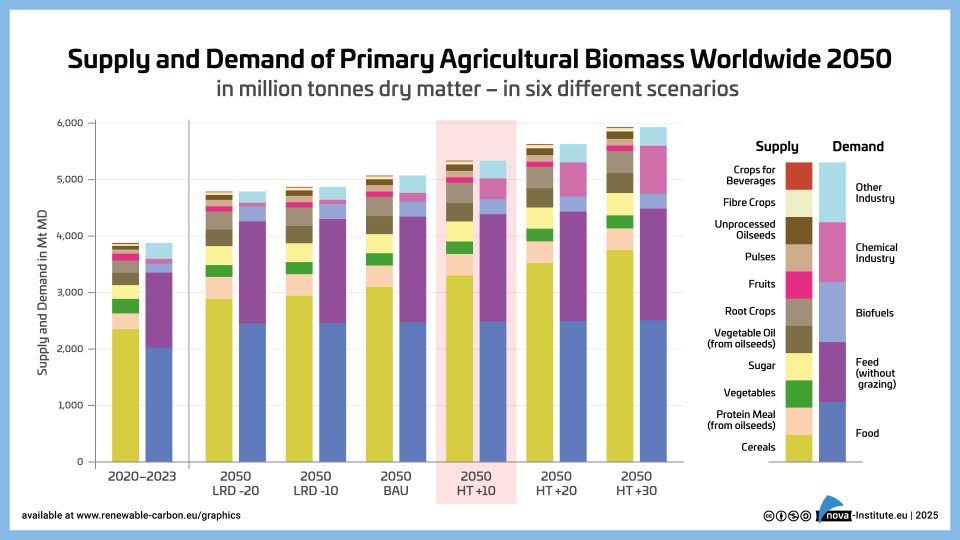
Supply and Demand of Agricultural Biomass Worldwide 2050 in HT +10 Scenario – Graphic (PNG)
Markets & Economy, Policy, Sustainability & Health
1 Page
47 Downloads -
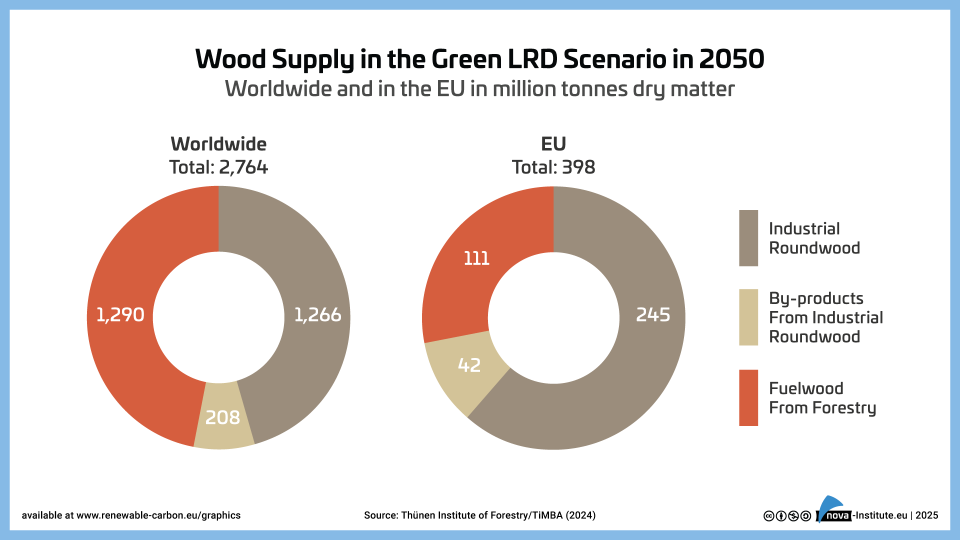
Wood Supply in the Green LRD Scenario in 2050 – Graphic (PNG)
Markets & Economy, Policy, Sustainability & Health
1 Page
16 Downloads -
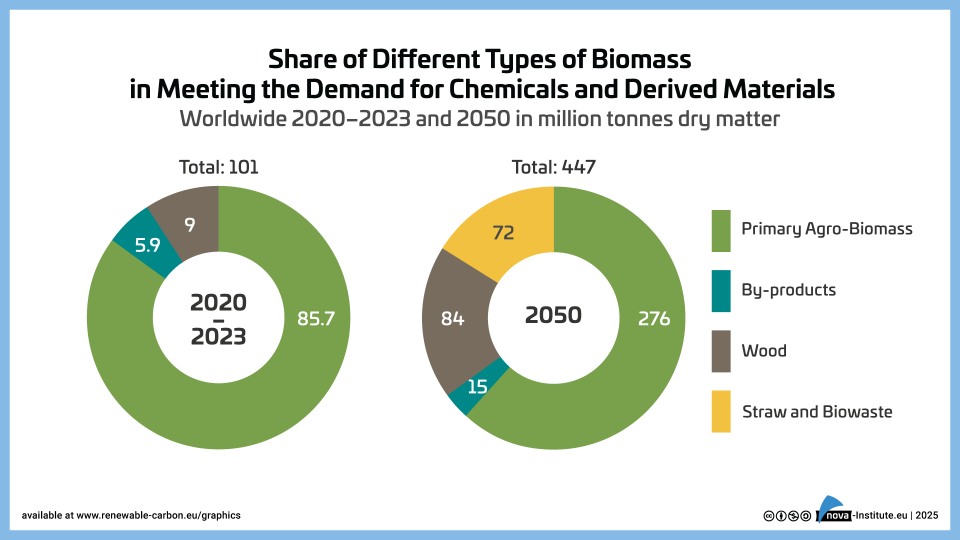
Share of Different Types of Biomass Worldwide 2023-2050 – Graphic (PNG)
Markets & Economy, Policy, Sustainability & Health
1 Page
72 Downloads -
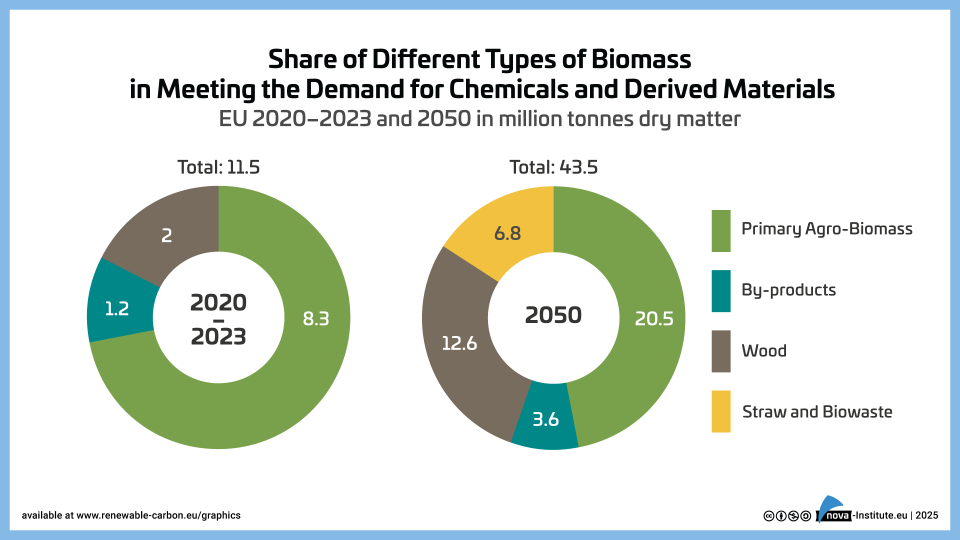
Share-of-Different-Types-of-Biomass-EU-2023–2050 – Graphic (PNG)
Markets & Economy, Policy, Sustainability & Health
1 Page
40 Downloads -
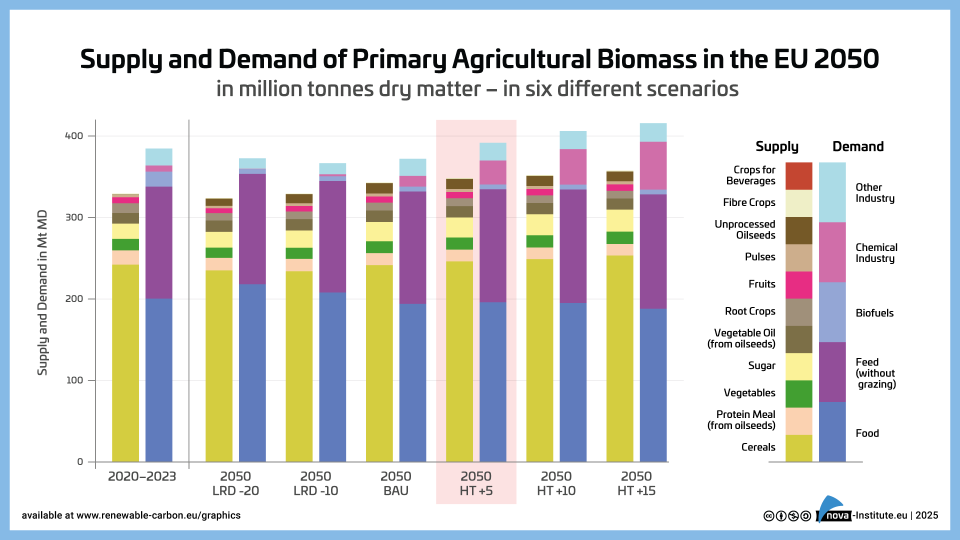
Supply and Demand of Agriculture Biomass in the EU 2050 – Graphic (PNG)
Markets & Economy, Policy, Sustainability & Health
1 Page
44 Downloads -
Supply and Demand of Agriculture Biomass Worldwide 2050 – Graphic (PNG)
Markets & Economy, Policy, Sustainability & Health
1 Page
49 Downloads -
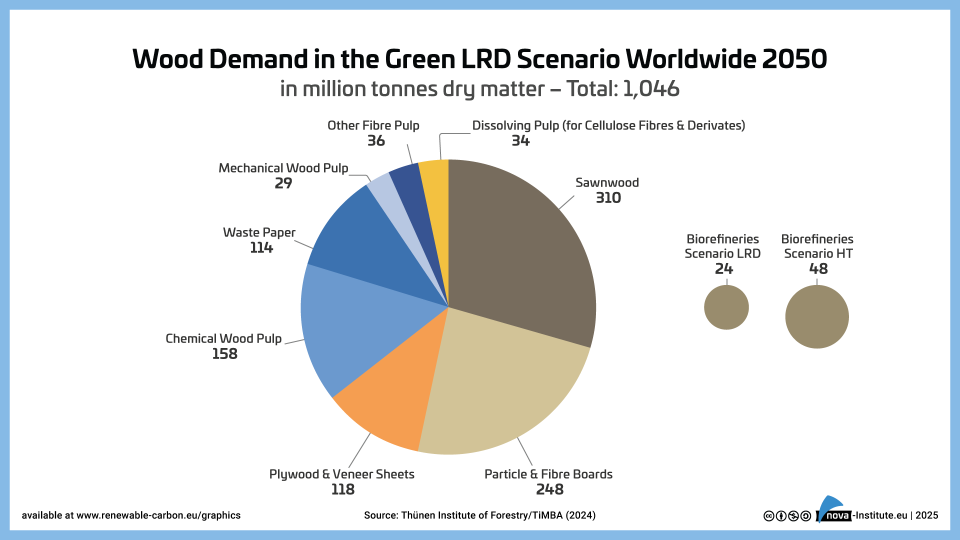
Wood Demand in the Green LRD Scenario Worldwide 2050 – Graphic (PNG)
Markets & Economy, Policy, Sustainability & Health
1 Page
17 Downloads -
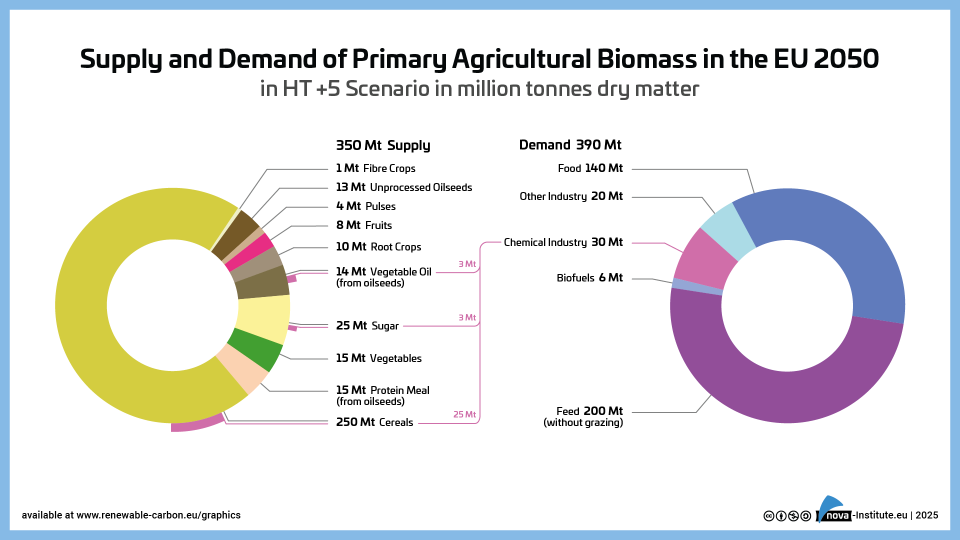
Supply and Demand of Agricultural Biomass in the EU 2050 in HT +5 Scenario – Graphic (PNG)
Markets & Economy, Policy, Sustainability & Health
1 Page
32 Downloads -
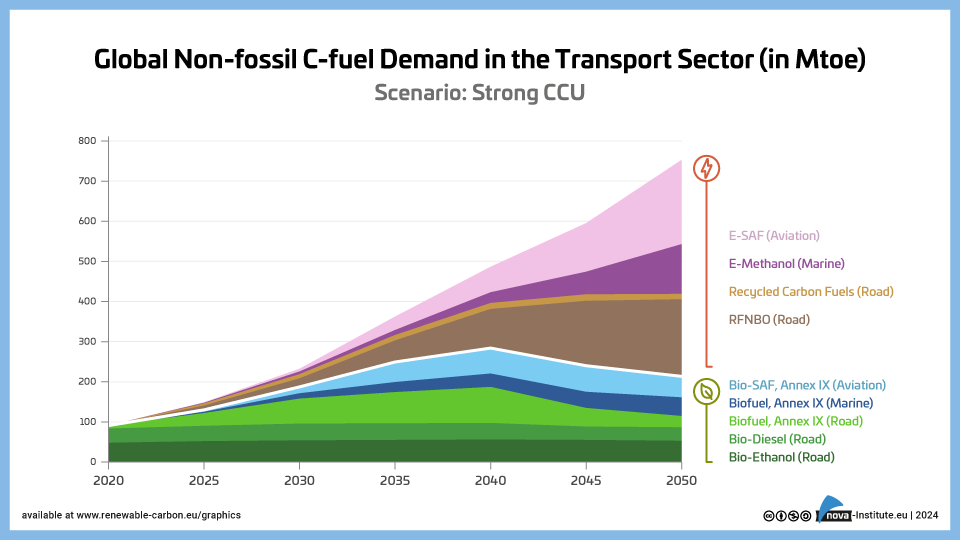
Global Non-fossil C-fuel Demand in the Transport Sector – Strong CCU – Graphic (PNG)
Markets & Economy, Policy, Sustainability & Health
1 Page
661 Downloads -
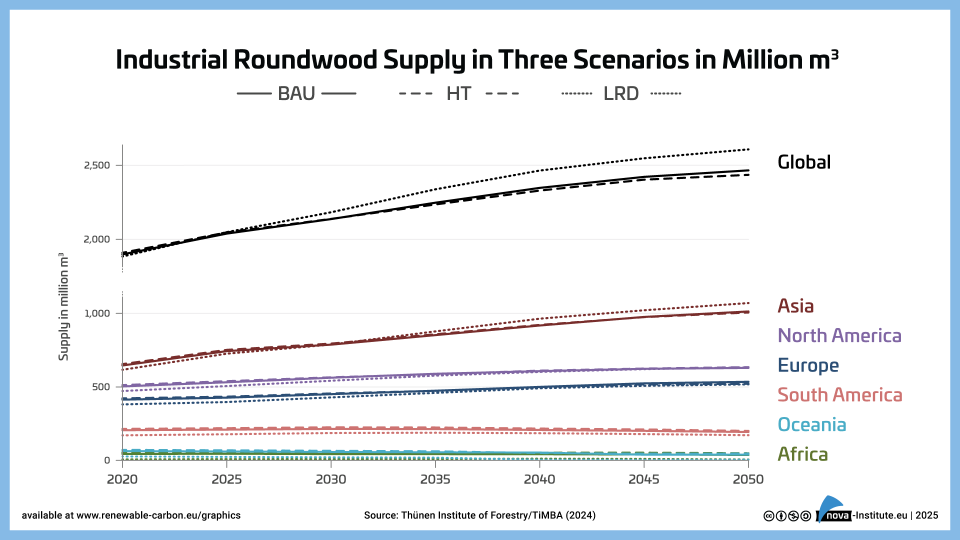
Industrial Roundwood Production in Three Scenarios in Million m3 – Graphic (PNG)
Markets & Economy, Policy, Sustainability & Health
1 Page
9 Downloads -
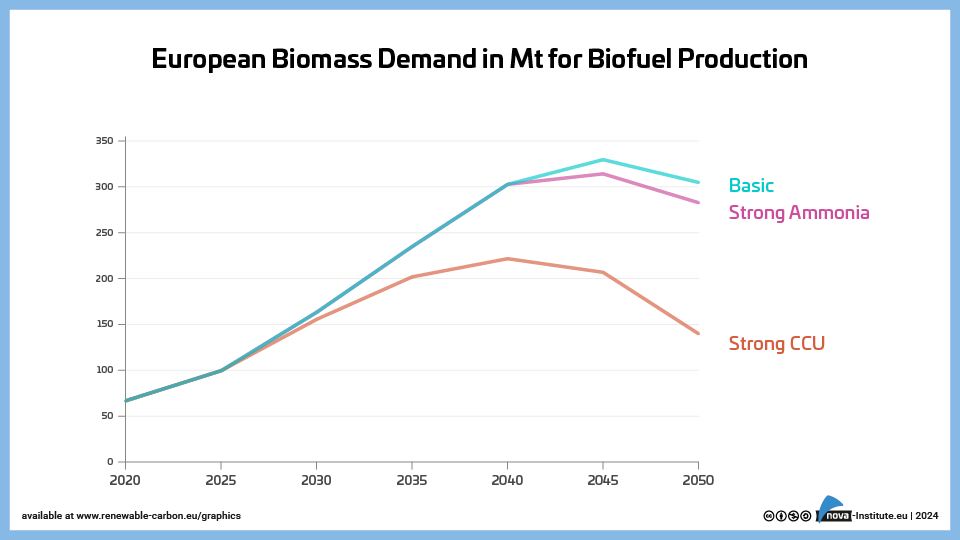
European Biomass Demand in Mt for Biofuel Production – Graphic (PNG)
Markets & Economy, Policy, Sustainability & Health
1 Page
33 Downloads -
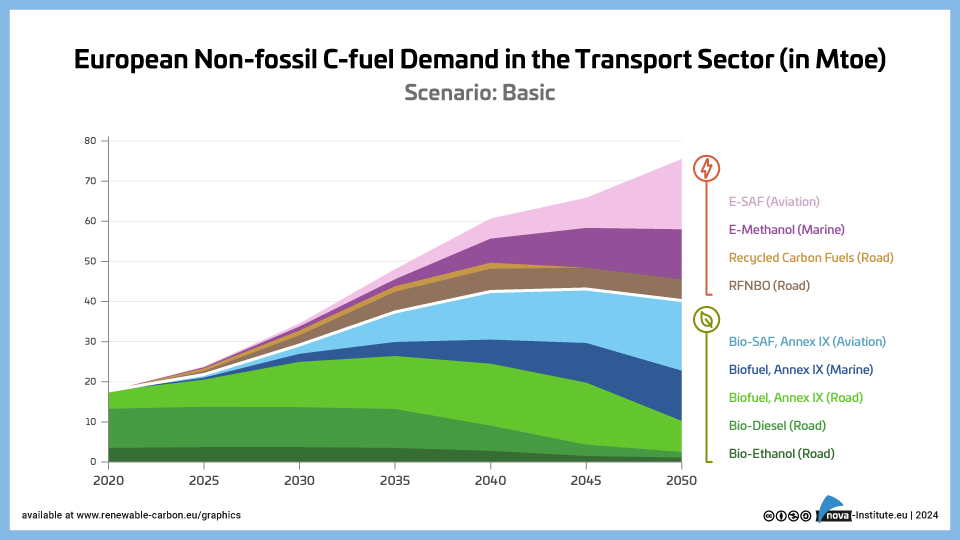
European Non-fossil C-fuel Demand in the Transport Sector – Basic – Graphic (PNG)
Markets & Economy, Policy, Sustainability & Health
1 Page
32 Downloads