


Showing 1–20 of 145
-
-
-
-
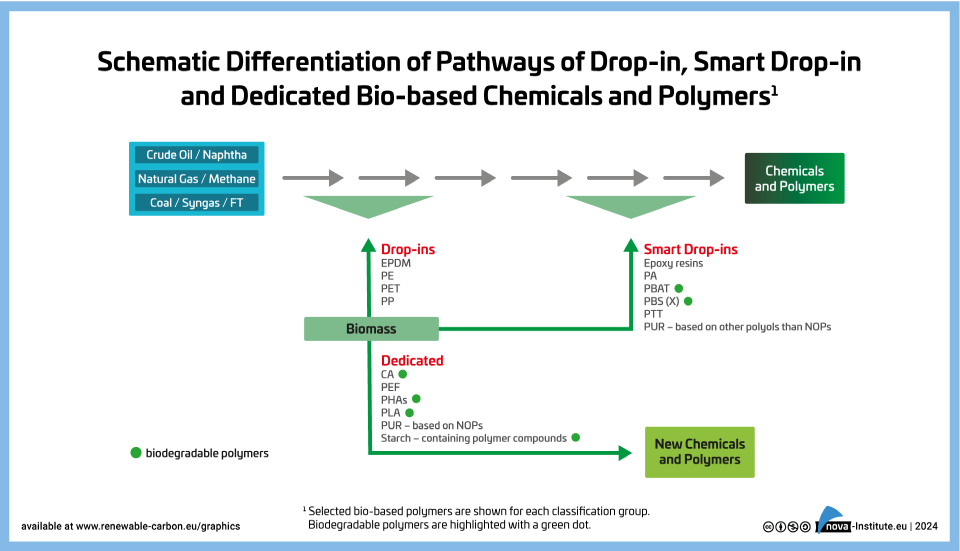
Schematic Differentiation of Pathways of Drop-in, Smart Drop-in and Dedicated Bio-based Chemicals and Polymers (PNG)
Markets & Economy
1 Page
37 Downloads
-
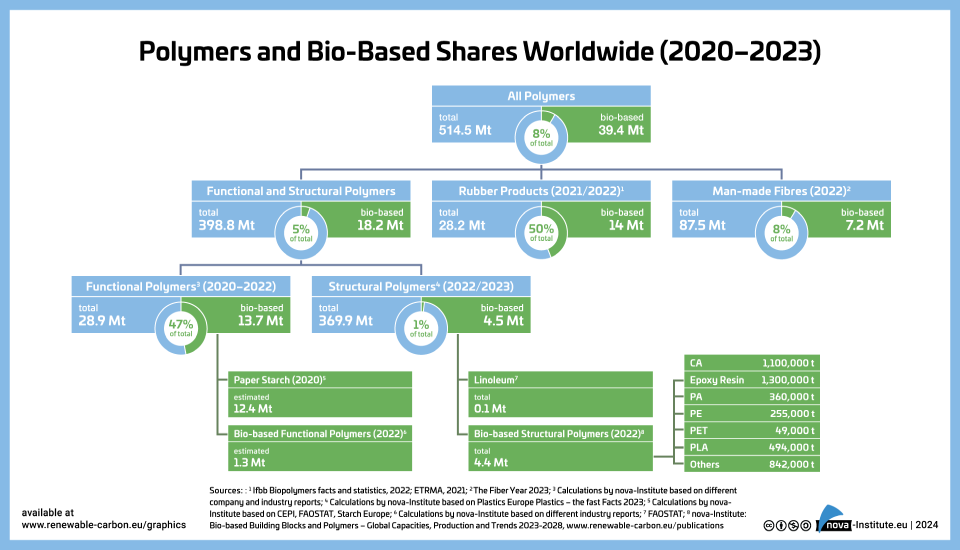
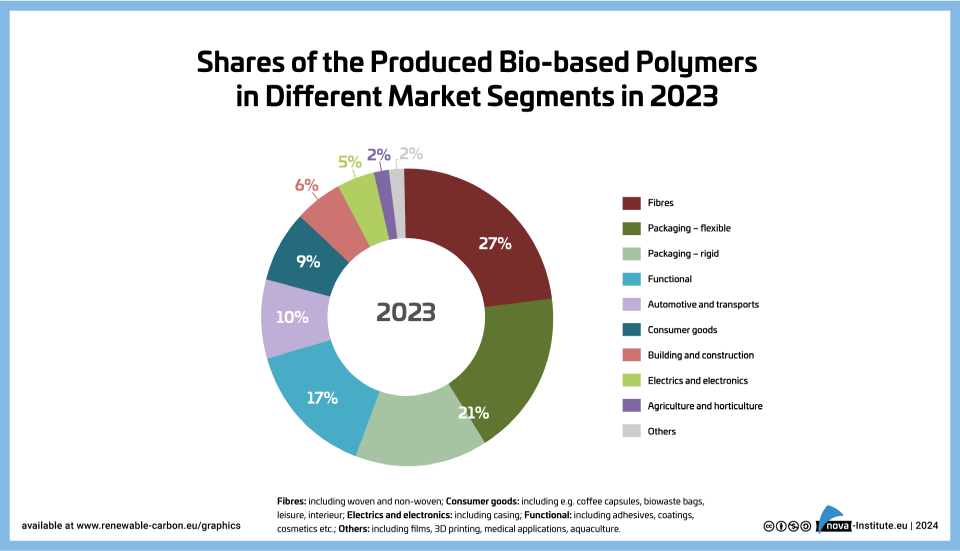
Shares of Produced bio-based polymers in different market segments (PNG)
Markets & Economy
1 Page
59 Downloads -
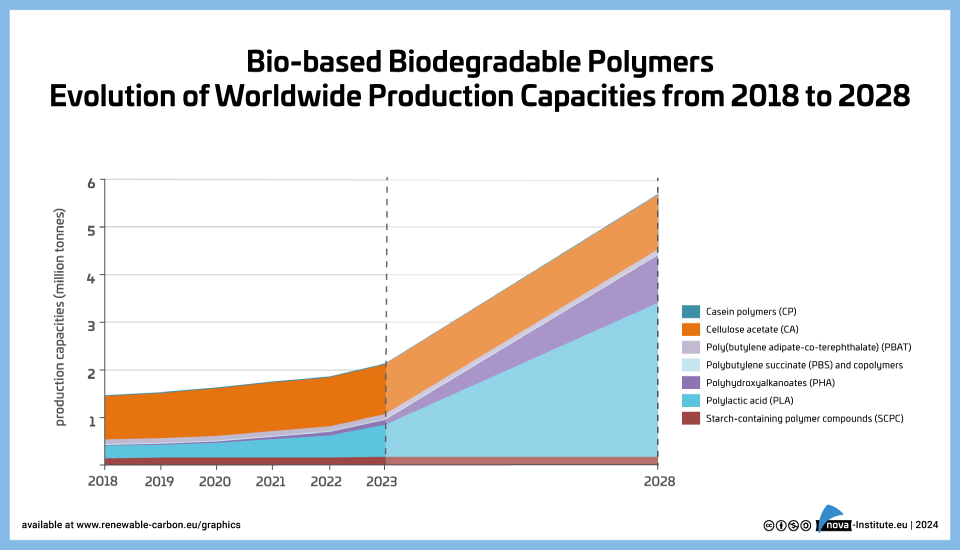
Bio-based Biodegradable Polymers Worldwide Production Capacities 2018-2028 (PNG)
Markets & Economy
1 Page
60 Downloads -
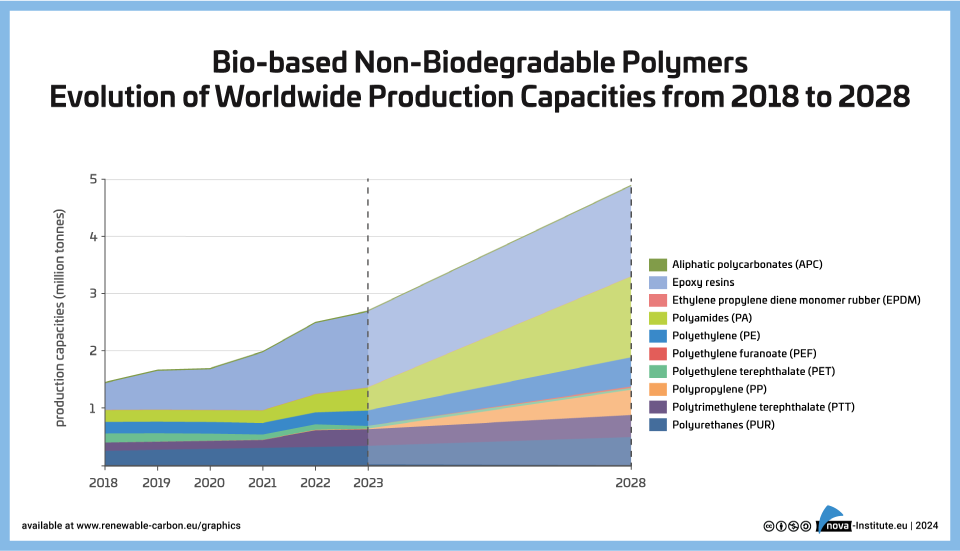
Bio-based Non-Biodegradable Polymers Evolution of Worldwide Production Capacities (PNG)
Markets & Economy
1 Page
34 Downloads -
-
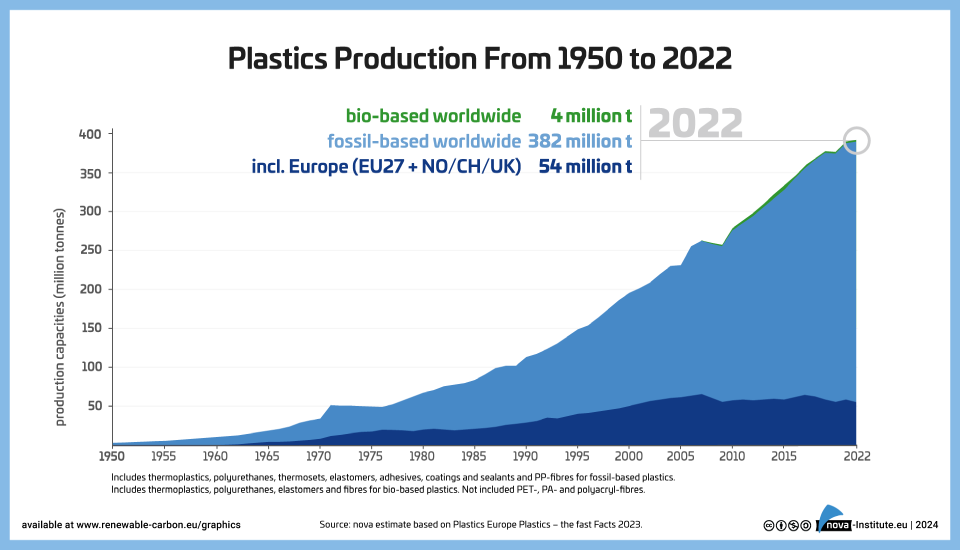
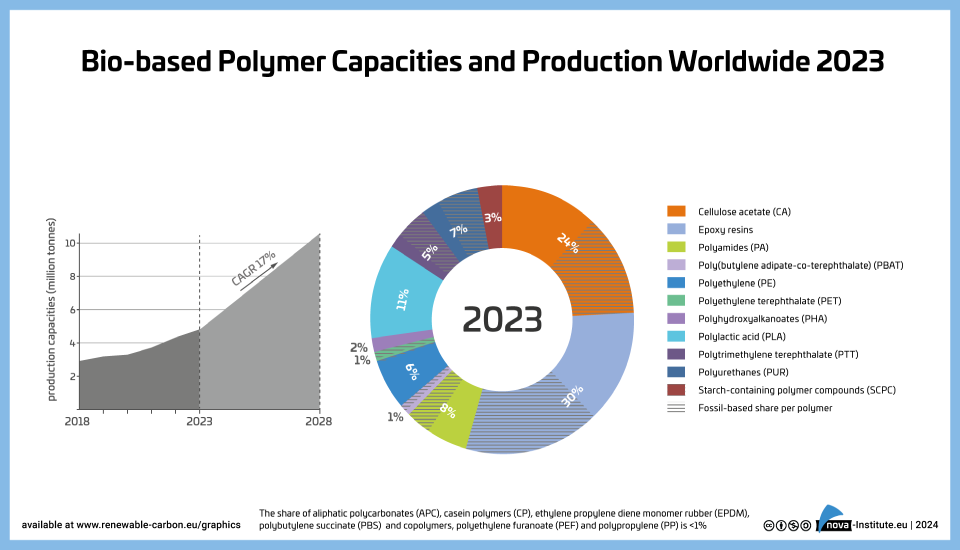
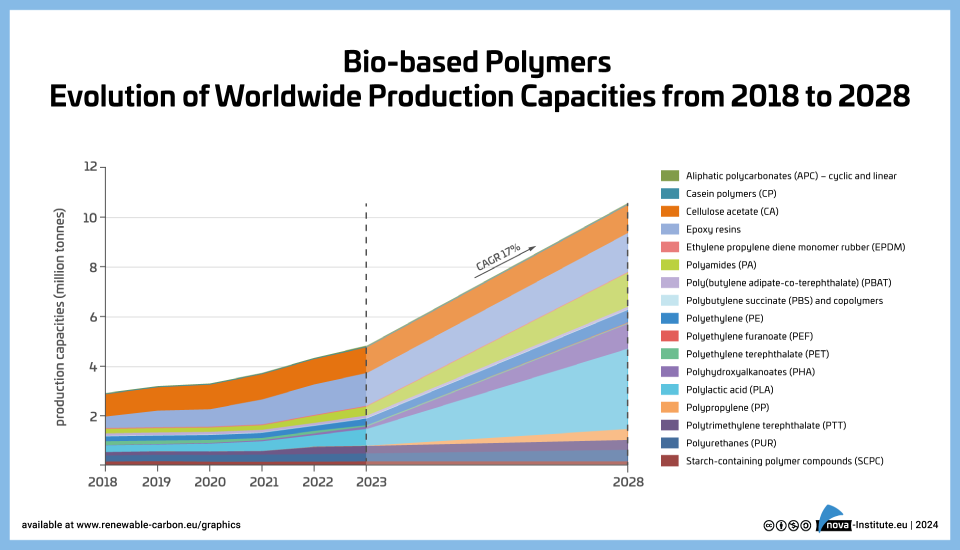
Bio-based Polymers – Evolution of worldwide production capacities from 2018 to 2028 (PNG)
Markets & Economy
1 Page
55 Downloads -
-
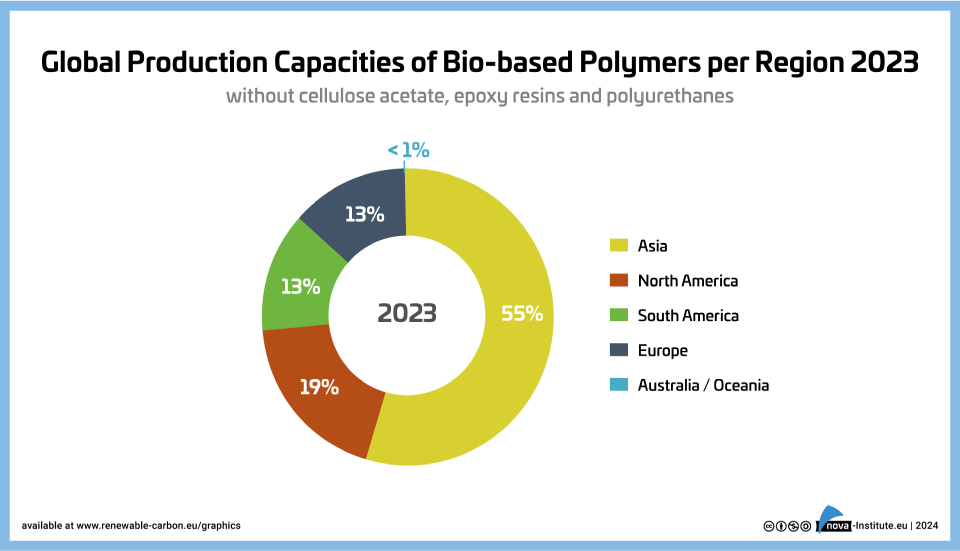
Global Production Capacities of Bio-based Polymers per Region 2022 (PNG)
Markets & Economy
1 Page
35 Downloads -
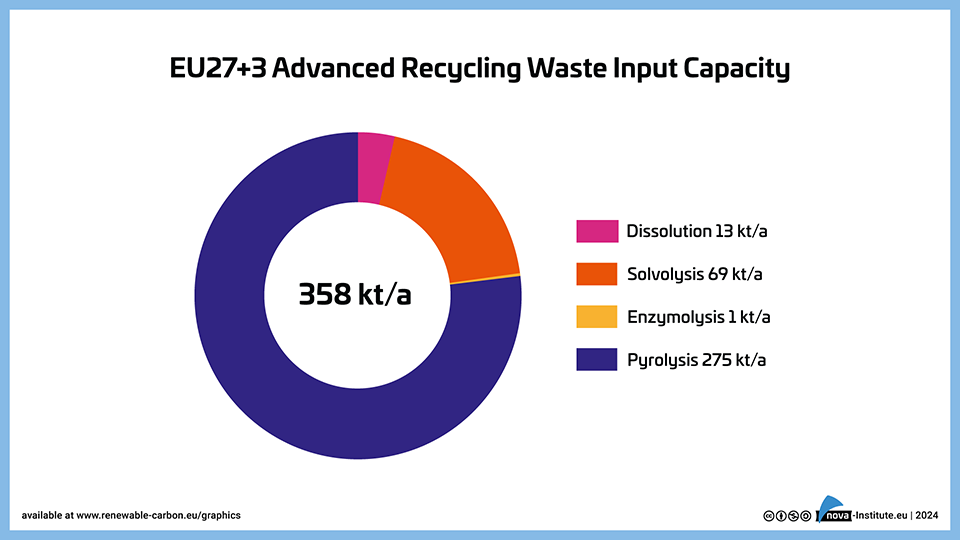
EU27+3 Advanced Recycling Waste Input Capacity (PNG)
Markets & Economy, Technology
1 Page
27 Downloads -
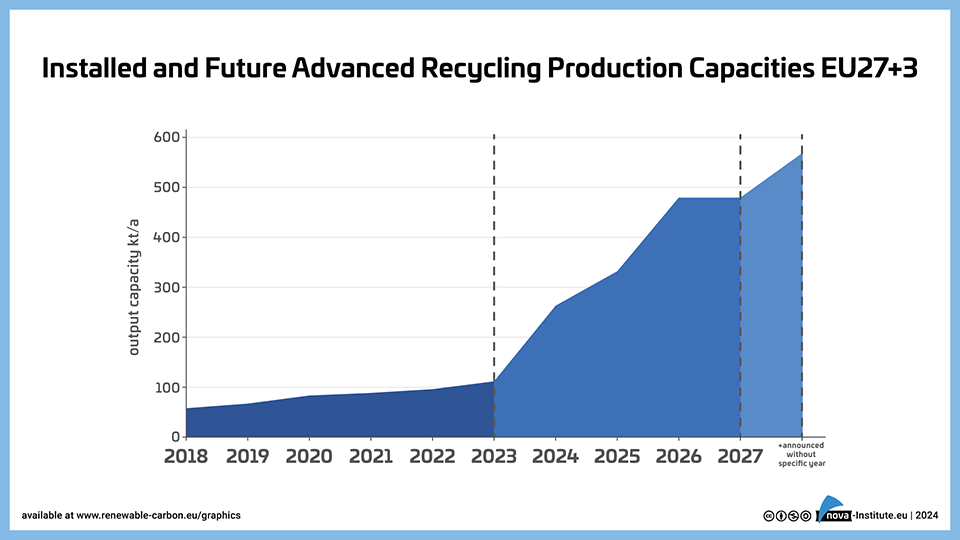
Installed and Future Advanced Recycling Production Capacities EU 27+3 (PNG)
Markets & Economy, Technology
1 Page
31 Downloads -
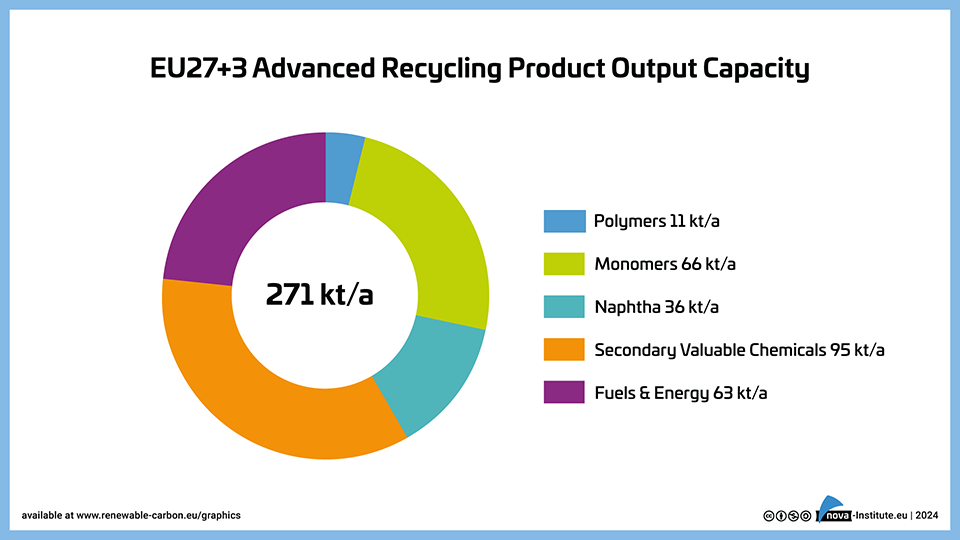
EU27+3 Advanced Recycling Product Output Capacity (PNG)
Markets & Economy, Technology
1 Page
24 Downloads -
-
Nora and her flyphone on renewable carbon (Comic)
Policy, Sustainability & Health
2 Pages
435 Downloads
-
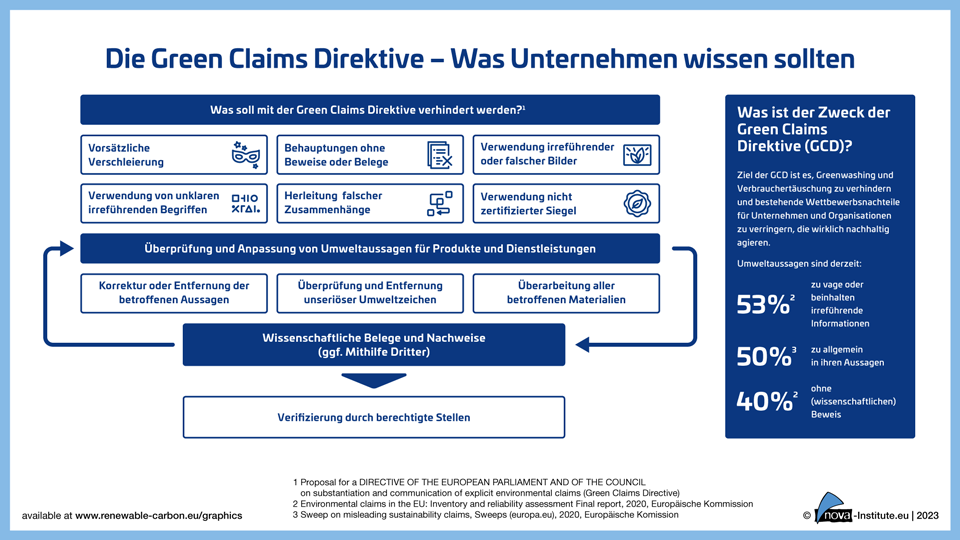
The Green-Claims-Directive – Was Unternehmen wissen sollten (PNG)
Policy, Sustainability & Health
1 Page
61 Downloads -
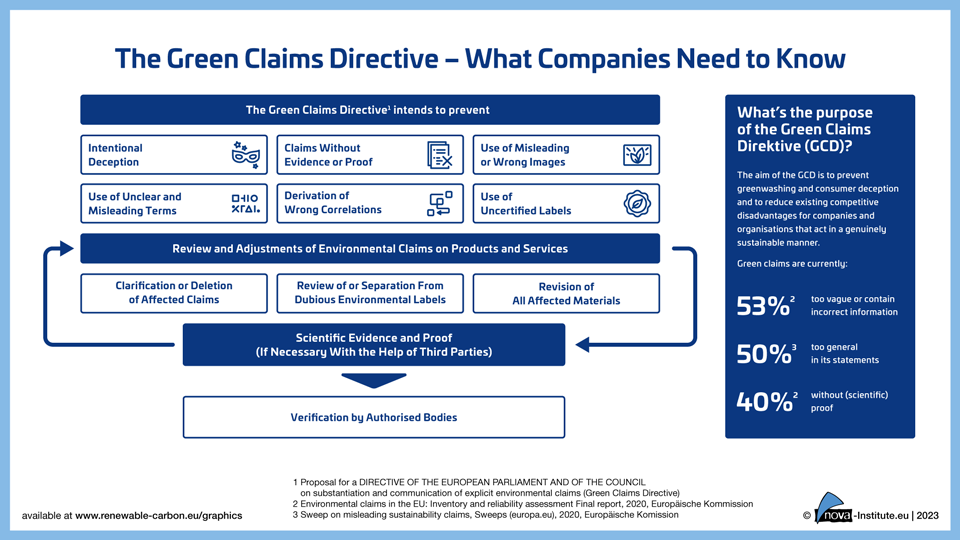
The Green-Claims-Directive – What Companies Need to Know (PNG)
Policy, Sustainability & Health
1 Page
193 Downloads -
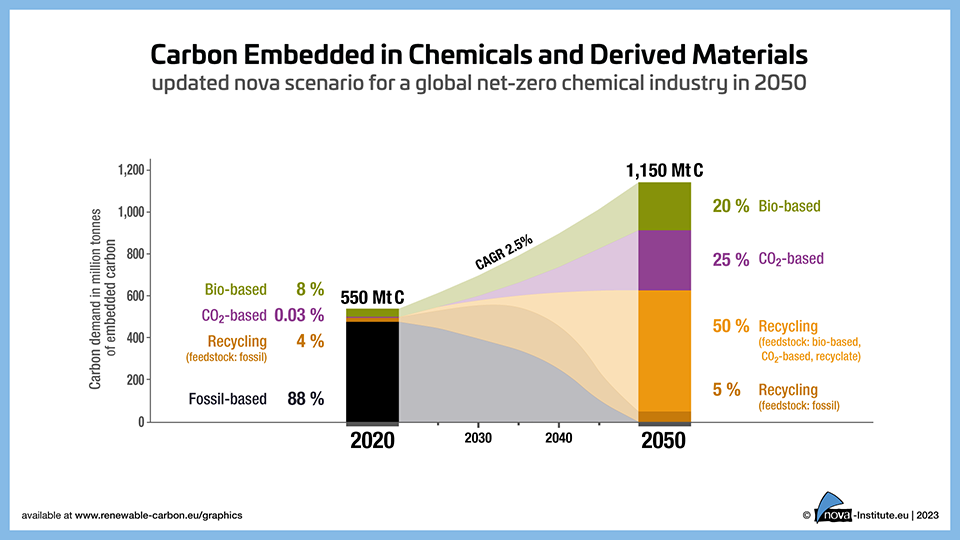
Explorative Scenario – Carbon Embedded in Chemicals and Derived Materials (PNG)
Markets & Economy, Policy
1 Page
475 Downloads -